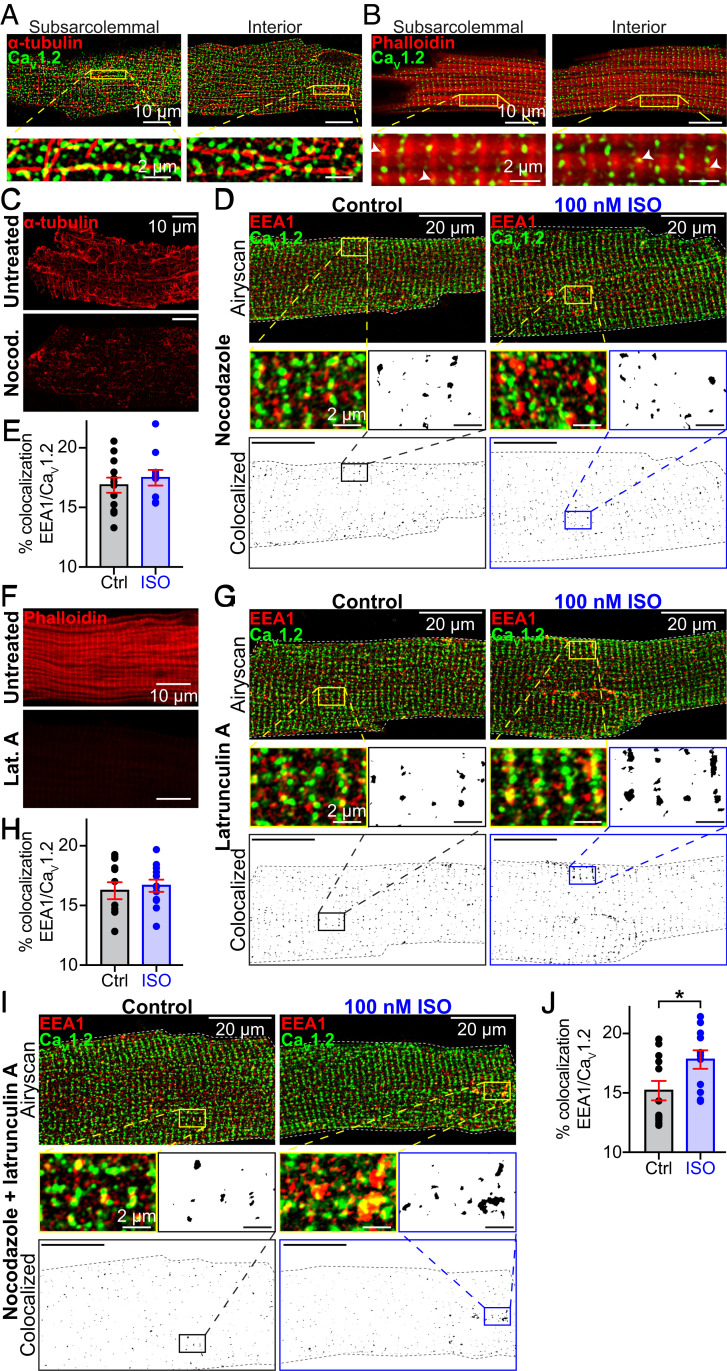
Fig. 3.
Actin and MT polymerization are essential for ISO-stimulated CaV1.2 recycling. Two-color Airyscan images of fixed AMVMs immunostained to examine the relative localization of CaV1.2 and (A) α-tubulin, or (B) phalloidin-stained actin. (C) The distribution of α-tubulin in untreated (Top) and nocodazole-treated AMVMs (Bottom). (D) Airyscan images of CaV1.2 and EEA1 distribution in nocodazole-treated control (n = 3, n = 12; Left) and ISO-stimulated (n = 3, n = 10; Right) AMVMs. (Bottom) Binary colocalization maps display pixels in which CaV1.2 and EEA1 expression precisely overlapped. (E) Histogram summarizing percent colocalization of EEA1 with CaV1.2 in nocodazole-treated cells. (F) Actin distribution in untreated (Top) and lat-A–treated cells (Bottom). (G) Airyscan images and binary colocalization maps of CaV1.2 and EEA1 distribution in lat-A–treated control (n = 3, n = 12; Left) and ISO-stimulated (n = 3, n = 12; Right) AMVMs. (H) Histogram showing percent colocalization of EEA1 with CaV1.2 in lat-A–treated AMVMs. (I) Airyscan images and binary colocalization maps of AMVMs treated with both lat-A and nocodazole under control (n = 3, n = 12) and ISO stimulated conditions (n = 3, n = 11), with accompanying summary histogram (J). Statistical analyses were unpaired t tests. *P < 0.05.

