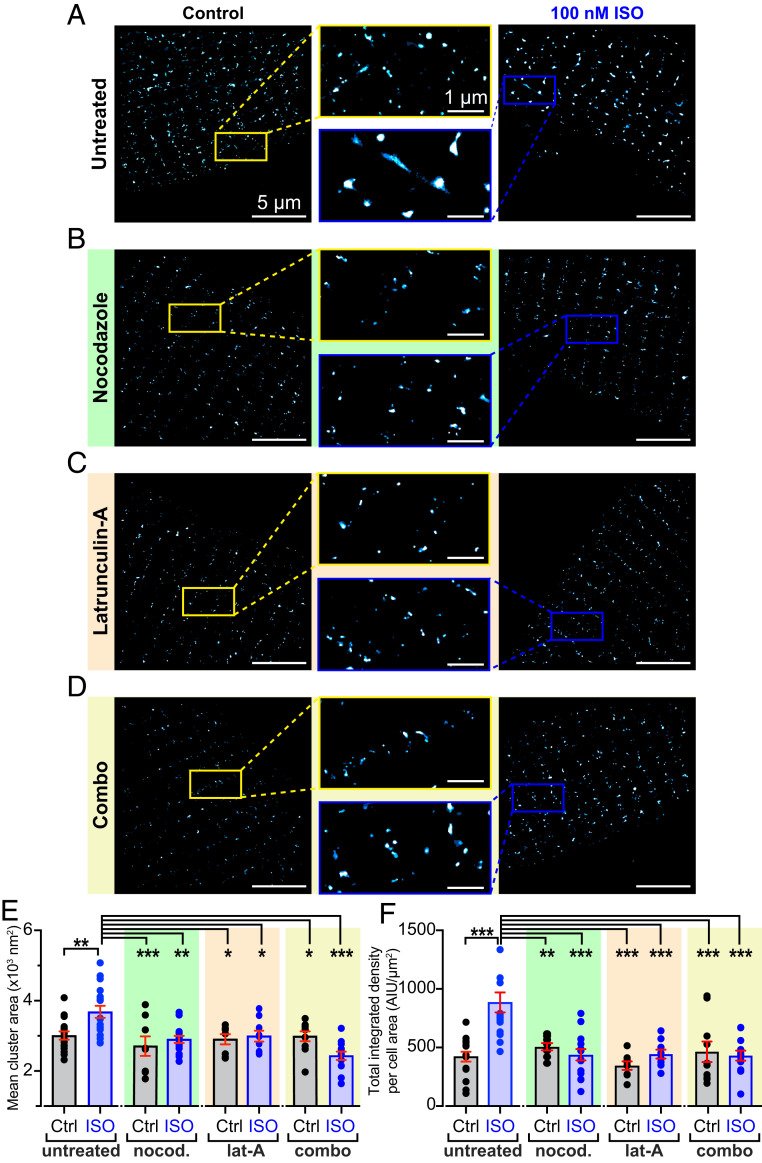
Fig. 6.
βAR-stimulated CaV1.2 superclustering and enhanced sarcolemmal expression requires an intact MT cytoskeleton. Superresolution GSD localization maps of control (Left) and 100 nm ISO‐stimulated (Right), fixed, AMVMs immunostained to examine CaV1.2 channel distribution under (A) untreated (control: n = 4, n = 16; ISO: n = 4, n = 17), (B) nocodazole-treated (control: n = 3, n = 8; ISO: (n = 3, n = 15), (C) lat-A–treated (control: n = 3, n = 8; ISO: (n = 3, n = 9), and (D) combo-treated (control: n = 2, n = 10; ISO: (n = 3, n = 13) conditions. Maps were pseudocolored “cyan hot” and received a one-pixel median filter for display purposes. Yellow (control) and blue (ISO) boxes indicate the location of the zoomed‐in regions displayed in the center. (E and F) Aligned dot plots showing mean CaV1.2 channel cluster areas and normalized total integrated density in each condition. Two-way ANOVA. ***P < 0.001; **P < 0.01; *P < 0.05.

