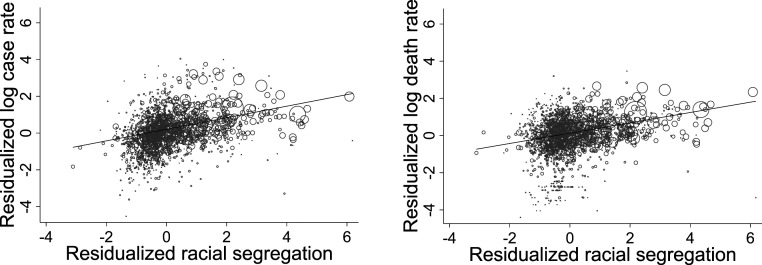
Fig. 2.
Relationship between multigroup Relative Diversity Index and COVID-19 infection rates (Left) and mortality (Right) net of state fixed effects. The x axis represents the residuals from a regression of the multigroup Relative Diversity Index on the set of state dummies. The y axis represents the residuals from a regression of the corresponding COVID-19 outcome on the set of state dummies. The size of the dots is proportional to the county population. COVID-19 outcomes are measured as of September 30, 2020.

