Fig. 5.
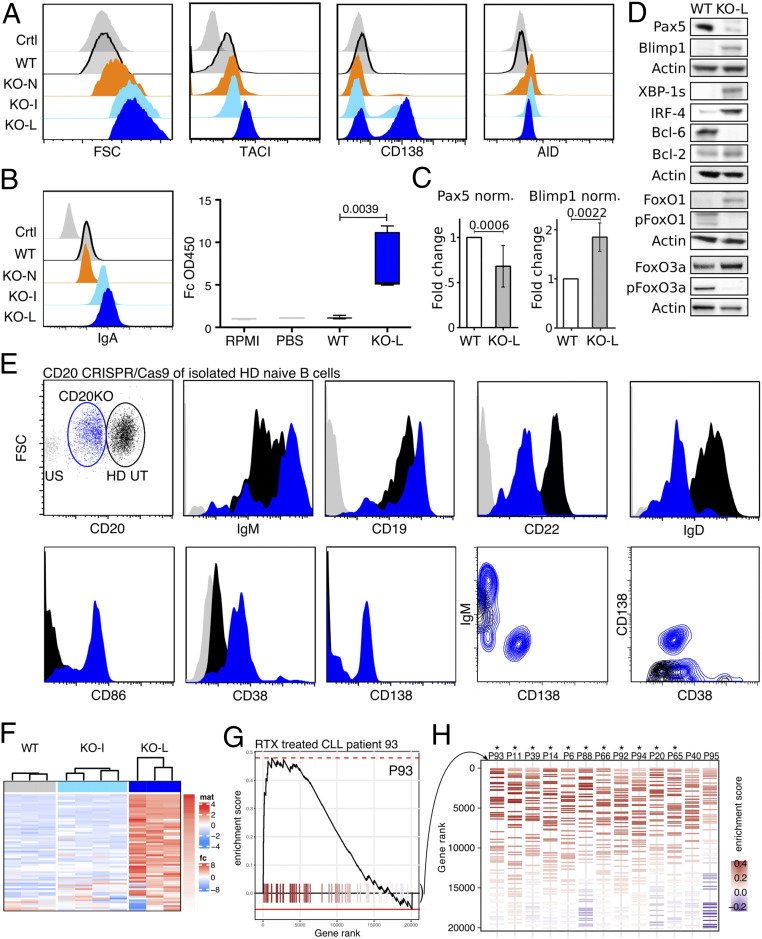
Increased PC differentiation of CD20KO Ramos B cells and primary naive B cells and of CLL B cell relapse after RTX therapy. (A) Flow cytometry analysis showing size (FSC-A) and expression of PC markers TACI, CD138, and AID on KO-N, KO-I, and KO-L Ramos B cells compared to WT and unstained control (Ctrl); n = 6. (B) Expression of surface IgA-BCR (Left) and ELISA of IgA secretion (Right) of KO-L compared to Ramos WT, PBS, and RPMI control. (C) Summarized intracellular flow cytometry analysis of six independently generated CD20KO Ramos B cell lines showing the fold change (FC) of Pax5 and Blimp1 expression of KO-L Ramos B cell lines compared to WT. (D) Representative examples of Western blot analysis for B cell differentiation markers of KO-L Ramos B cells compared to WT. Lysates were taken 20 d after induction of CD20KO; n = 3. (E) Flow cytometry analysis 24 h after CD20CRISPR/Cas9 CD20KO of isolated naive HD B cells. CD20low B cells were gated and shown in blue, compared to transfection control (empty plasmid) in black; n = 3. (F) PLASMA UP GENES Heatmap, expression of PC differentiation up-regulated genes. The color code indicates the row-wise scaled intensity across the samples. Genes are ranked according to their log2 fold FC in WT (Left) vs. KO-L (Right); n ≥ 3. (G) Example of enrichment plot (curve) of PC differentiation up-regulated genes (ticks) in one patient. (H) Enrichment barcode illustrating the distribution of PC differentiation up-regulated genes (colored segments) in every individual patient. From GSE37168. Treated patients were ordered from Left to Right based on their enrichment score, from high to low. Significant enrichment scores are depicted by an asterisk (*).

