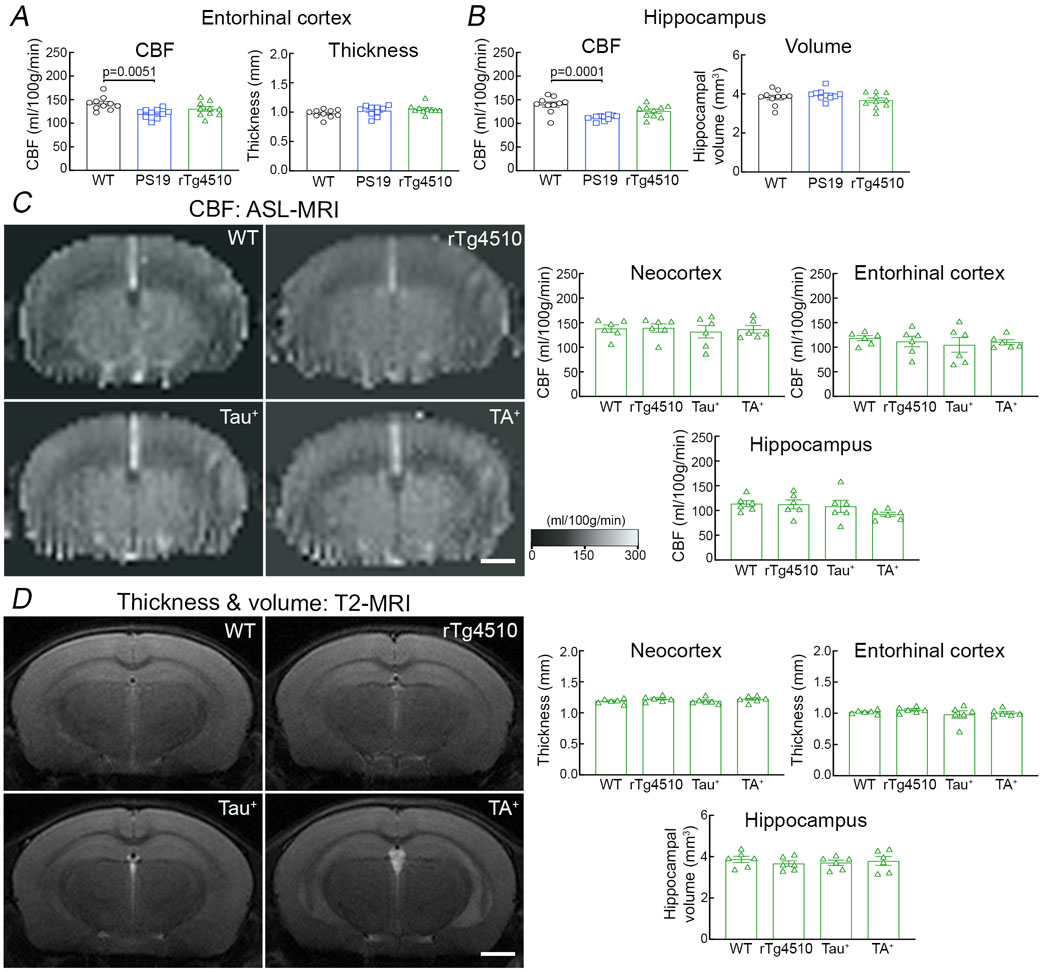
Extended Data Fig. 1. Resting CBF and thickness in PS19, rTg4510, and WT mice at 2-3 months of age.
Resting CBF and thickness were bilaterally assessed by ASL- and T2-MRI, respectively, in neocortex, entorhinal cortex, and hippocampus at the bregma level from −1.22 to −1.70 mm. A-B. A small reduction in entorhinal (A) and hippocampal (B) CBF is found in PS19 mice and not in rTg4510 mice compared to age-matched WT mice, while entorhinal cortex thickness (A) and hippocampal volume (B) are comparable in both strains. N=10/group; one-way analysis of variance (ANOVA) with Tukey’s test for multiple comparisons. C-D. Resting CBF (C) and thickness (D) in the neocortex, entorhinal cortex, and hippocampus are comparable in rTg4510 mice, expressing both tau (Tau+) and transactivator (TA+), and their littermates (WT; Tau+ only; TA+ only). Scale bar=1 mm; N=5/group; one-way ANOVA with Tukey’s test. Data are presented as mean±SEM. See Source Data 7 for statistical parameters.

