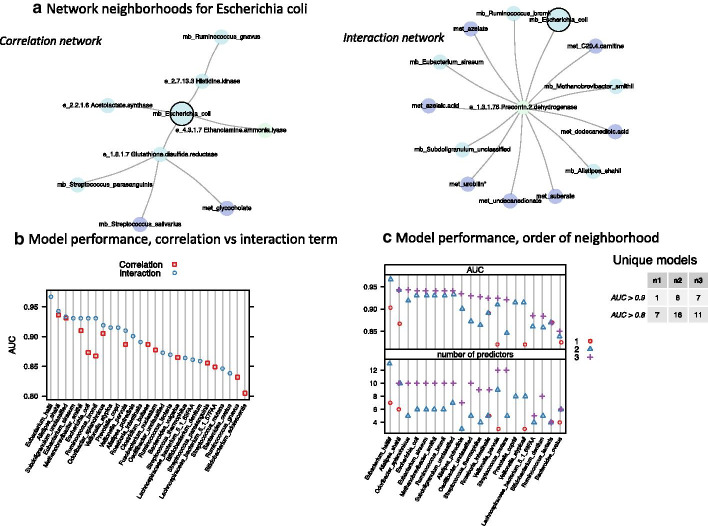
Fig. 5.
Comparison of model performance for differing configuration parameters. a Network neighborhoods for Escherichia_coli (highlighted with black border) from Vnet created using correlation (no interaction term) and Vnet using an interaction term. The two neighborhoods include different predictors, illustrating that the two Vnets include different analytes and relationships among analytes. b Comparison of model performance: Vnet created using correlation (no interaction term) compared to Vnet using an interaction term. The set of models for each configuration differs because the microbes in each Vnet differ. AUC for all models from each configuration is shown, with models ordered by AUC. When a model can be generated from both Vnets, the AUC for the interaction network is higher (mean = 0.93) than for the correlation network (mean = 0.90, p-value = 0.016). c Comparison of models by order of network neighborhood. AUC and number of predictors are shown for models generated using neighborhoods of order 1, 2, and 3. Models are ordered by maximum AUC, regardless of neighborhood order. For neighborhoods of order 3, models indicated by # (Eubacterium_hallii, Veillonella_atypica, and Prevotella_copri) failed to converge. Thus, no data exists for order 3 for these microbes. The number of unique models for AUC > 0.9 and AUC > 0.8 is shown in the accompanying table. Jitter has been added to minimize overplotting, but some symbols still overlap, such as AUC and the number of predictors for Ruminococcus_lactaris (second from right)

