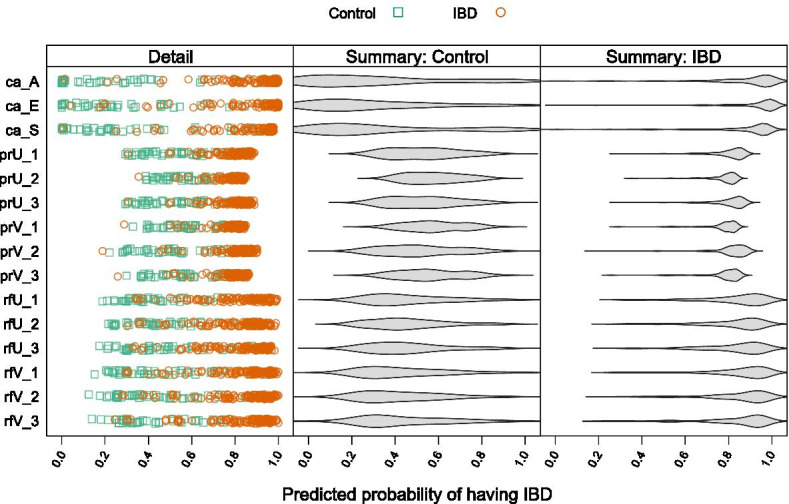
Fig. 6.

Distribution of predicted probabilities. Left panel: participant-level detail of predicted probabilities of having IBD for 3 CANTARE models, 6 penalized regressions, and 6 random forests. Green squares represent controls, orange circles represent people with IBD. Predictions made by CANTARE models have greater dynamic range than those made by penalized regressions or random forest (p-value = 1.3 × 10–05). Predictions made by CANTARE models have greater separation between high and low values. Center and right panels: violin plots illustrating overall distribution of predicted probabilities, separated by IBD group
