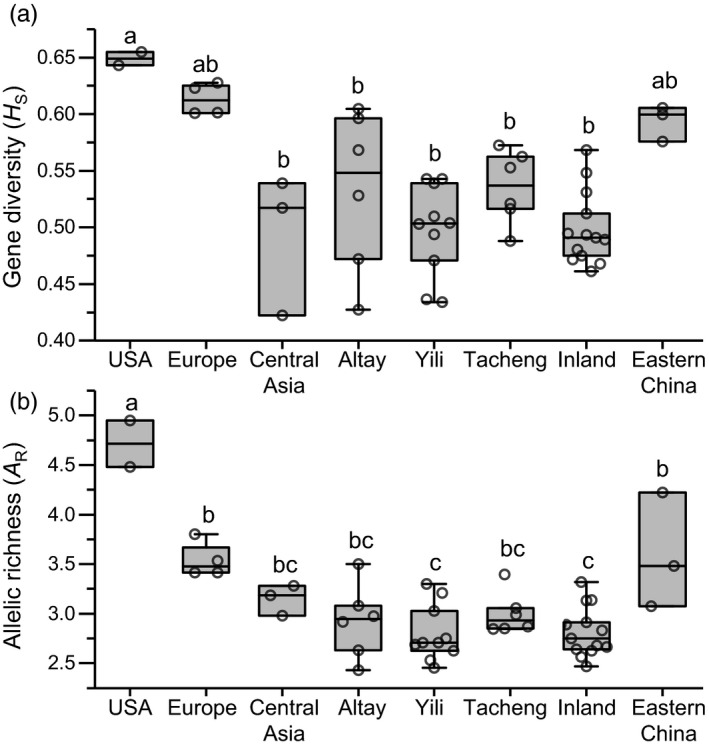
FIGURE 2.

Genetic diversity of Colorado potato beetle populations among geographic divisions, according to (a) gene diversity (H S) and (b) rarefied allelic richness (A R). Raw data points are shown together with boxplots and the values for each population are available in Table S1. Letters denote significant differences between geographic divisions (p < .05 after Bonferroni correction). Geographic divisions are the same as in Figure 1 and Table S1
