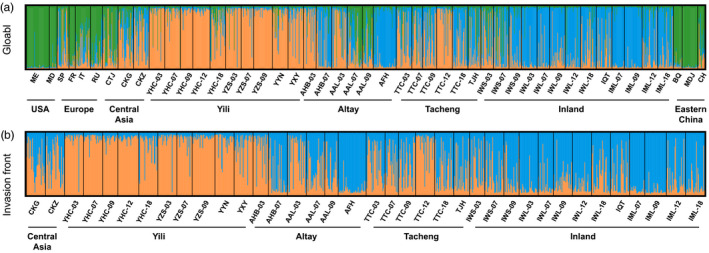
FIGURE 3.

Barplots of STRUCTURE clustering analyses for Colorado potato beetle populations at the (a) global scale (K = 3) and (b) local scale along the invasion front (K = 2). Each individual is denoted by a narrow vertical bar and its proportional membership in each of K cluster is represented by a different color. Geographic divisions are the same as in Figure 1
