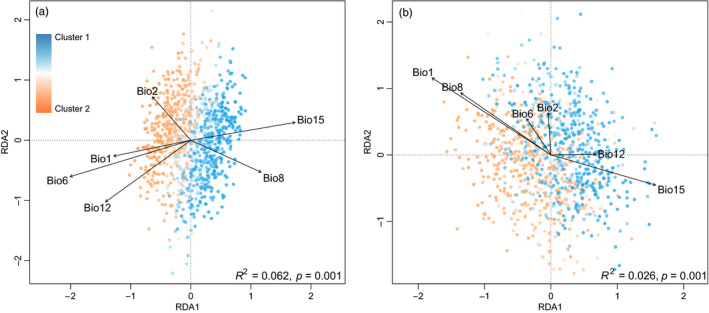
FIGURE 5.

Distance‐based redundancy analyses (dbRDAs) on individual genetic distance explained by the environmental effects of climate. (a) dbRDA model considering only climatic effects, and (b) partial dbRDA model constraining least‐cost distance‐landcover effect to analyze the independent effect of climatic variables. Bio1, annual mean temperature; Bio2, mean diurnal range; Bio6, minimum temperature of coldest month; Bio8, mean temperature of wettest quarter; Bio12, annual precipitation; Bio15, precipitation seasonality. Individuals were colored according to the proportion assigned to the two STRUCTURE clusters (Figure 3b). Longer arrows indicate higher correlations between variable and genetic distance in the corresponding direction
