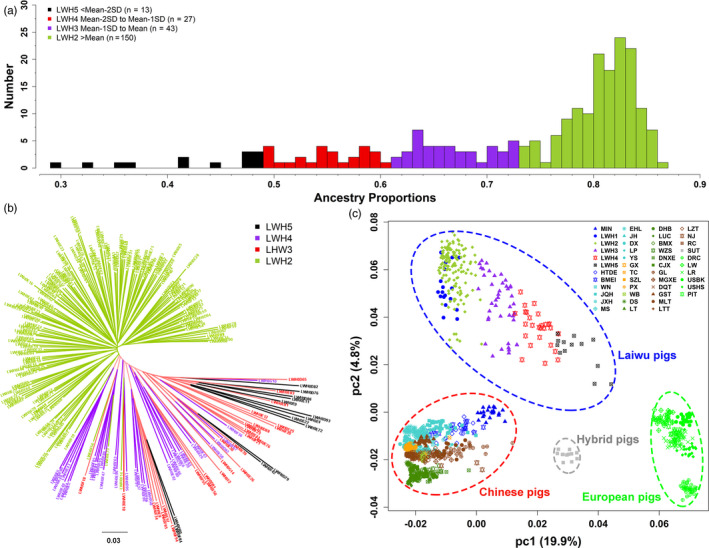
FIGURE 3.

Compositions of Chinese lineages in Laiwu pigs. (a) Distribution of Chinese lineage compositions in 233 Laiwu pigs. Proportions of Chinese lineage in the genomes of Laiwu pigs are shown in the x‐axis. (b) Neighbor‐joining phylogenetic tree for the 233 Laiwu pigs. (c) Principle component analysis of 1,111 pigs including the 233 Laiwu pigs. LWH2, 150 Laiwu pigs with Chinese lineage compositions greater than the mean value of the 233 Laiwu pigs. LWH3, 43 Laiwu pigs with Chinese lineage compositions between the mean value and mean minus one standard deviation (Mean ‐ 1SD). LWH4, 27 Laiwu pigs with Chinese lineage compositions ranging from Mean ‐ 1SD to Mean ‐ 2SD. LWH5, 13 Laiwu pigs with Chinese lineage compositions less than Mean ‐ 2SD. The four populations are indicated by different colors
