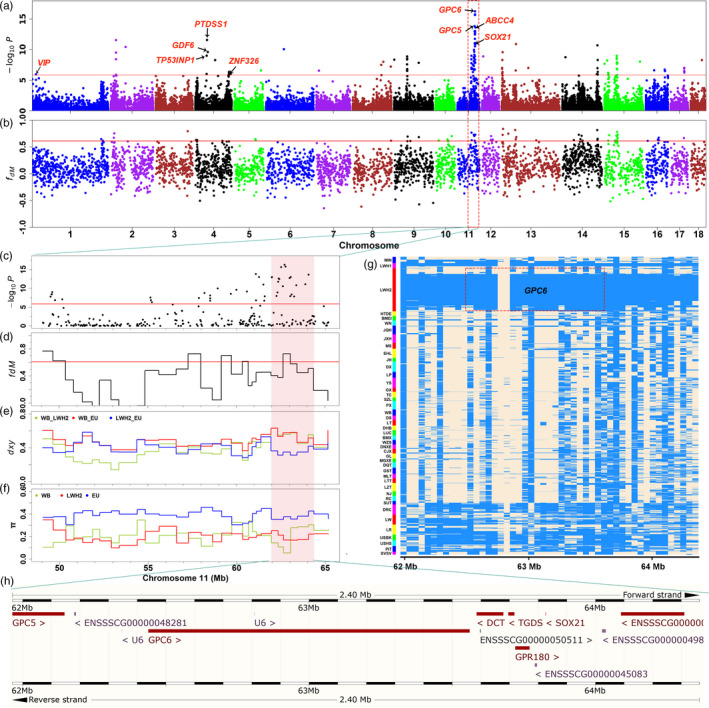
FIGURE 6.

Signatures of selection and introgression revealed by comparison of the genomes of Laiwu pigs with those of other Chinese indigenous pigs. (a) Genome‐wide analysis of EigenGWAS between 150 Laiwu pigs and other 683 Chinese pigs. The red line indicates the 0.05/35027 threshold. The y‐axis represents the negative logarithm of P values for the EigenGWAS that explored the first principle component as phenotype. (b) Introgression regions identified in the LWH2 genome. A modified f‐statistic (fdM) for 10 SNPs per window with 2 SNPs stepping is plotted along the autosomes. The red line corresponds to significance level threshold (p = .01). (c–f) The 16 Mb region in SSC11 (49061964–65169959) detected by EigenGWAS, fdM, absolute divergence (dxy) and nucleotide diversity (π) statistics, respectively. The area (11:61964048–64362534) on the pink background showed the significant selection and introgression, low dxy value (blue line) between LWH2 and EU, and reduced the π value (red line) in LHW2. (g) Haplotype heat map of the 2.4 Mb (11:61964048–64362534) region encompassing the GPC6 gene. Major and minor alleles in Laiwu pigs are indicated by beige and light blue, respectively. (h) Annotated genes in the region of 2.4 Mb in SSC11 (61964048–64362534)
