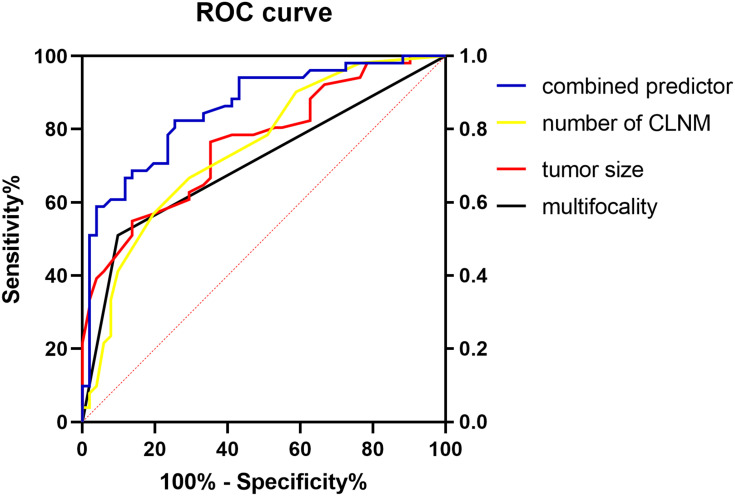
Figure 2.
The ROC curve of multifocality, tumor size, number of central LNM and combined predictor. The area under the curve of the multifocality, tumor size, the number of CLNM and combined predictor was 0.706 (95% CI, 0.603–0.808), 0.762 (95% CI, 0.653–0.842), 0.748 (95% CI, 0.670–0.853) and 0.855 (95% CI, 0.782–0.928), respectively (all P<0.05).
Abbreviation: CLNM, central lymph node metastasis.

