
Figure 5.
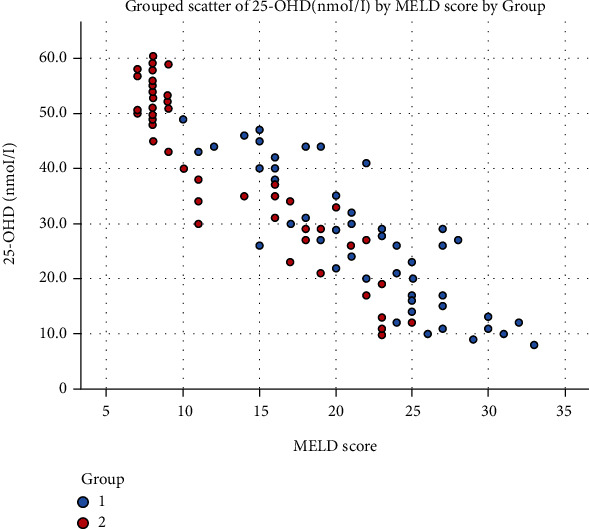
Grouped scatter plot showing the correlation between the 25-OHD level and MELD score (Afifi, Hussein, and Rizk, 2020).
Official websites use .gov
A
.gov website belongs to an official
government organization in the United States.
Secure .gov websites use HTTPS
A lock (
) or https:// means you've safely
connected to the .gov website. Share sensitive
information only on official, secure websites.
Grouped scatter plot showing the correlation between the 25-OHD level and MELD score (Afifi, Hussein, and Rizk, 2020).