
Figure 7.
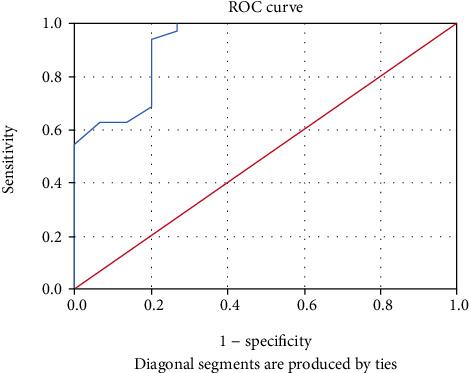
ROC curve for the 25-OHD level to predict improvement in HE group (patients who have recovered and did not die) (Afifi, Hussein, and Rizk, 2020).
Official websites use .gov
A
.gov website belongs to an official
government organization in the United States.
Secure .gov websites use HTTPS
A lock (
) or https:// means you've safely
connected to the .gov website. Share sensitive
information only on official, secure websites.
ROC curve for the 25-OHD level to predict improvement in HE group (patients who have recovered and did not die) (Afifi, Hussein, and Rizk, 2020).