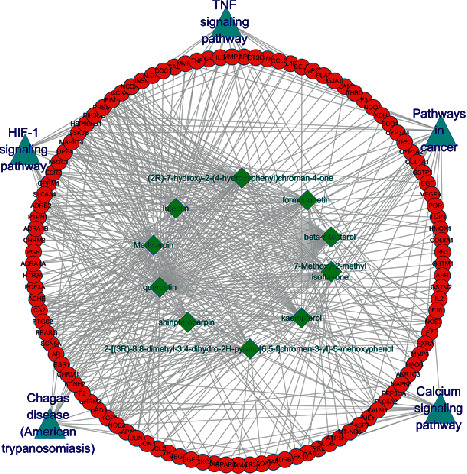
Figure 8.

The compound-target-pathway network of XFZY on CHD. The read circles represent potential protein targets, the green rhombuses represent bioactive compounds, and the blue triangles represent signaling pathways. The edges represent the interactions between them.
