FIGURE 2.

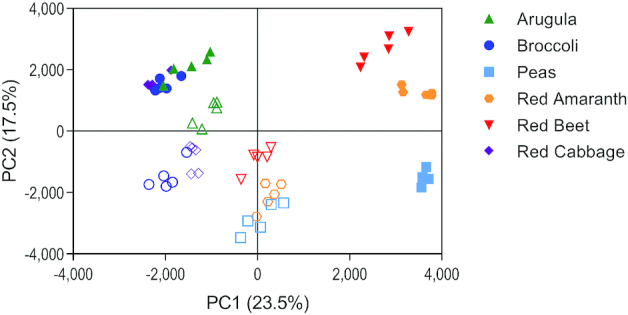
Principal component analysis of metabolites detected from 6 microgreen species and their mature counterparts. Solid shapes represent microgreens and open shapes represent the mature counterpart for each species. PC, principal component.

Principal component analysis of metabolites detected from 6 microgreen species and their mature counterparts. Solid shapes represent microgreens and open shapes represent the mature counterpart for each species. PC, principal component.