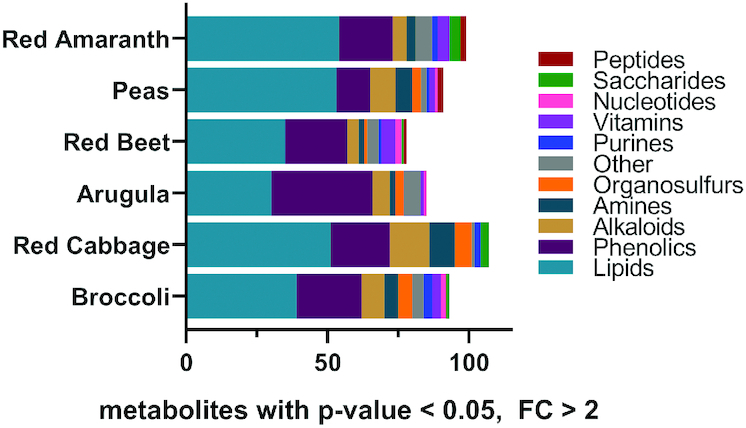
FIGURE 3.

Bar charts representing the total number of metabolites that differ between mature tissues and microgreens, within each species. Color is used to indicate a designated chemical class for each metabolite. Only metabolites that were significantly different (Student t test P value < 0.05 and fold change >2) between microgreens and their mature counterparts are included. FC, fold change.
