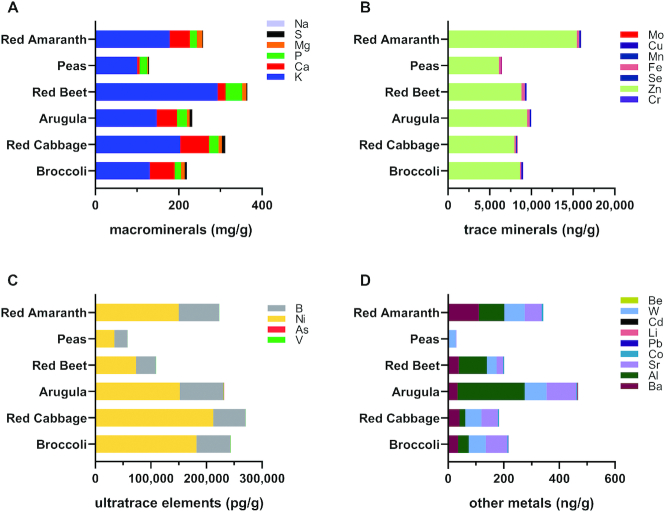
FIGURE 7.
Bar charts representing the proportions of minerals within each microgreen species. Color is used to indicate a specific mineral. Results of statistical analysis are not included in the figure. Macrominerals (A), trace minerals (B), ultratrace elements (C), and other metals (D). Al, aluminum; As, arsenic; B, boron; Ba, barium; Be, beryllium; Ca, calcium; Cd, cadmium; Co, cobalt; Cr, chromium; Cu, copper; Fe, iron; K, potassium; Li, lithium; Mg, magnesium; Mn, manganese; Mo, molybdenum; Na, sodium; Ni, nickel; P, phosphorus; Pb, lead; S, sulfur; Se, selenium; Sr, strontium; V, vanadium; W, tungsten; Zn, zinc.

