
Fig. 1.
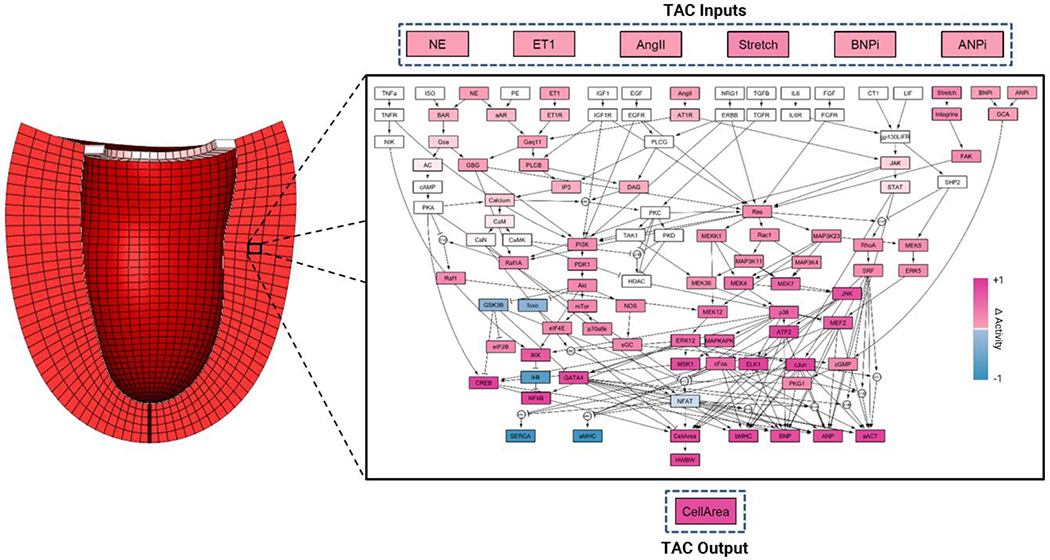
Schematic of the multiscale model of hypertrophy. A finite-element model of the left ventricle is coupled to a network model of intracellular hypertrophy signaling in cardiomyocytes. The network model shows the change in activation of each node in response to simulated transverse aortic constriction (TAC) compared to baseline activation. Increased activation is shown in pink and decreased activation is shown in blue