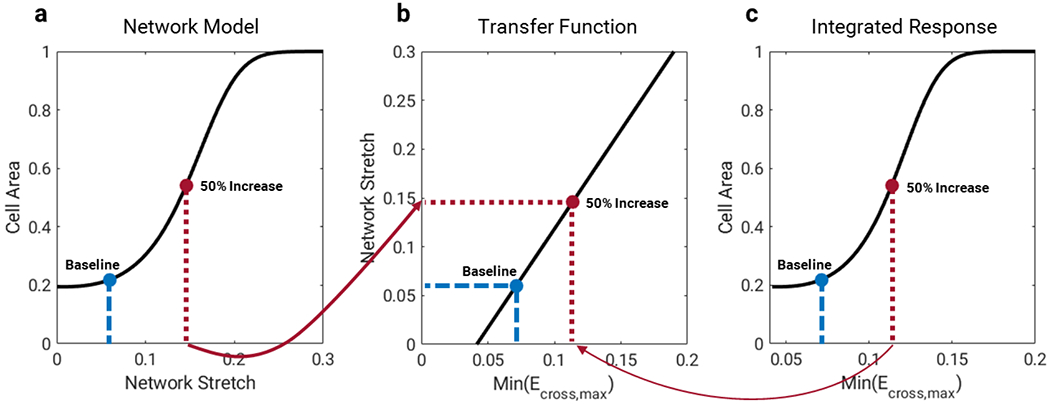
Fig. 3.

Mapping model inputs and outputs. a) Steady-state cell area response in the network model for different levels of normalized stretch input. b) Mechanical stimulus from the FEM (min(Ecross,max), see text for details), is mapped to the network model stretch input using a linear transfer function such that the baseline min(Ecross,max) corresponds to the baseline network stretch and values of min(Ecross,max) expected during TAC trigger half-maximal increases in cell area. c) Combining (a) and (b) yields an integrated response curve relating min(Ecross,max) directly to predicted steady-state cell area.
