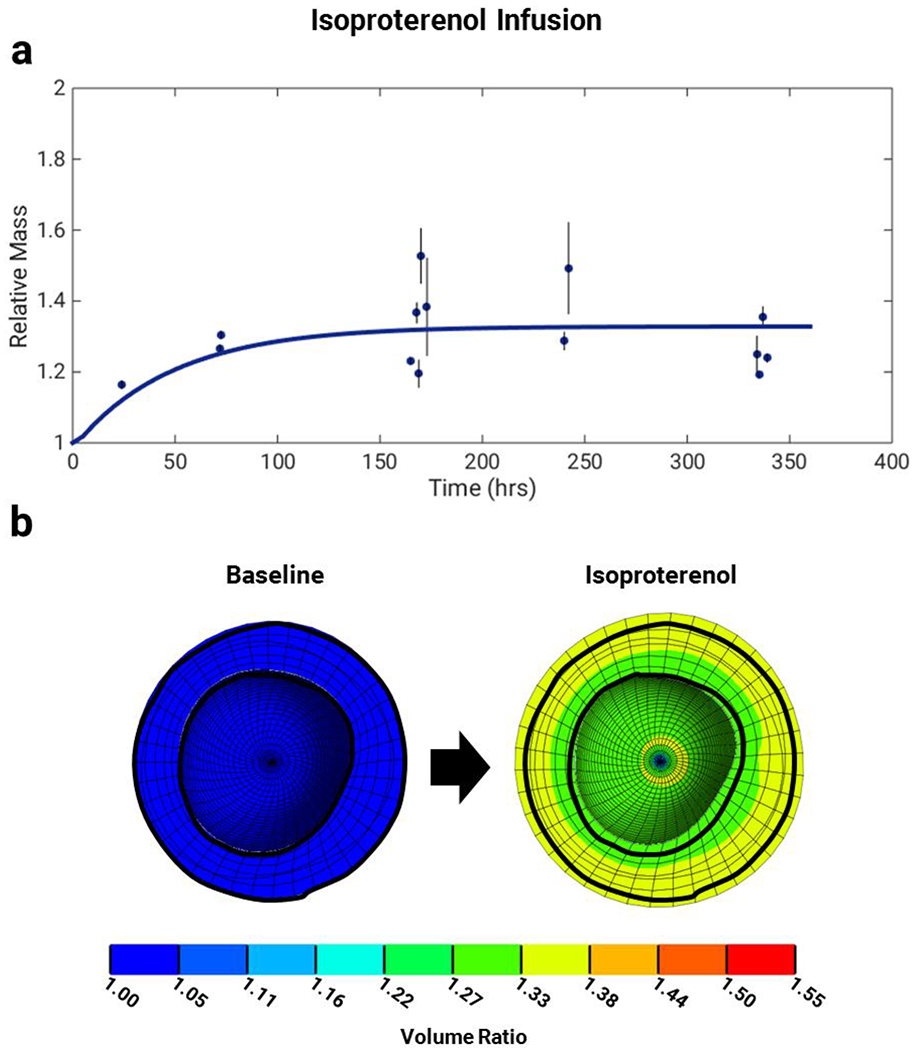
Fig. 5.

Simulations of isoproterenol infusion for two weeks. a) The multiscale model predicts a growth time course consistent with experimental data of isoproterenol infusion in mice (De Windt et al. 2001; Tuerdi et al. 2016; Allwood et al. 2014; Sucharov et al. 2013; Drews et al. 2010; Tshori et al. 2006; Zhang et al. 2016; Waters et al. 2013; Ryu et al. 2016; Jaehnig et al. 2006; Galindo et al. 2009; Brooks and Conrad 2009). Data are shown as mass fold change ratio relative to control ± standard deviation of ratio. b) Finite-element model short-axis cross-sections show volume ratios at end diastole for baseline (pre-growth) and after two weeks of isoproterenol infusion. Baseline outline is shown for clarity
