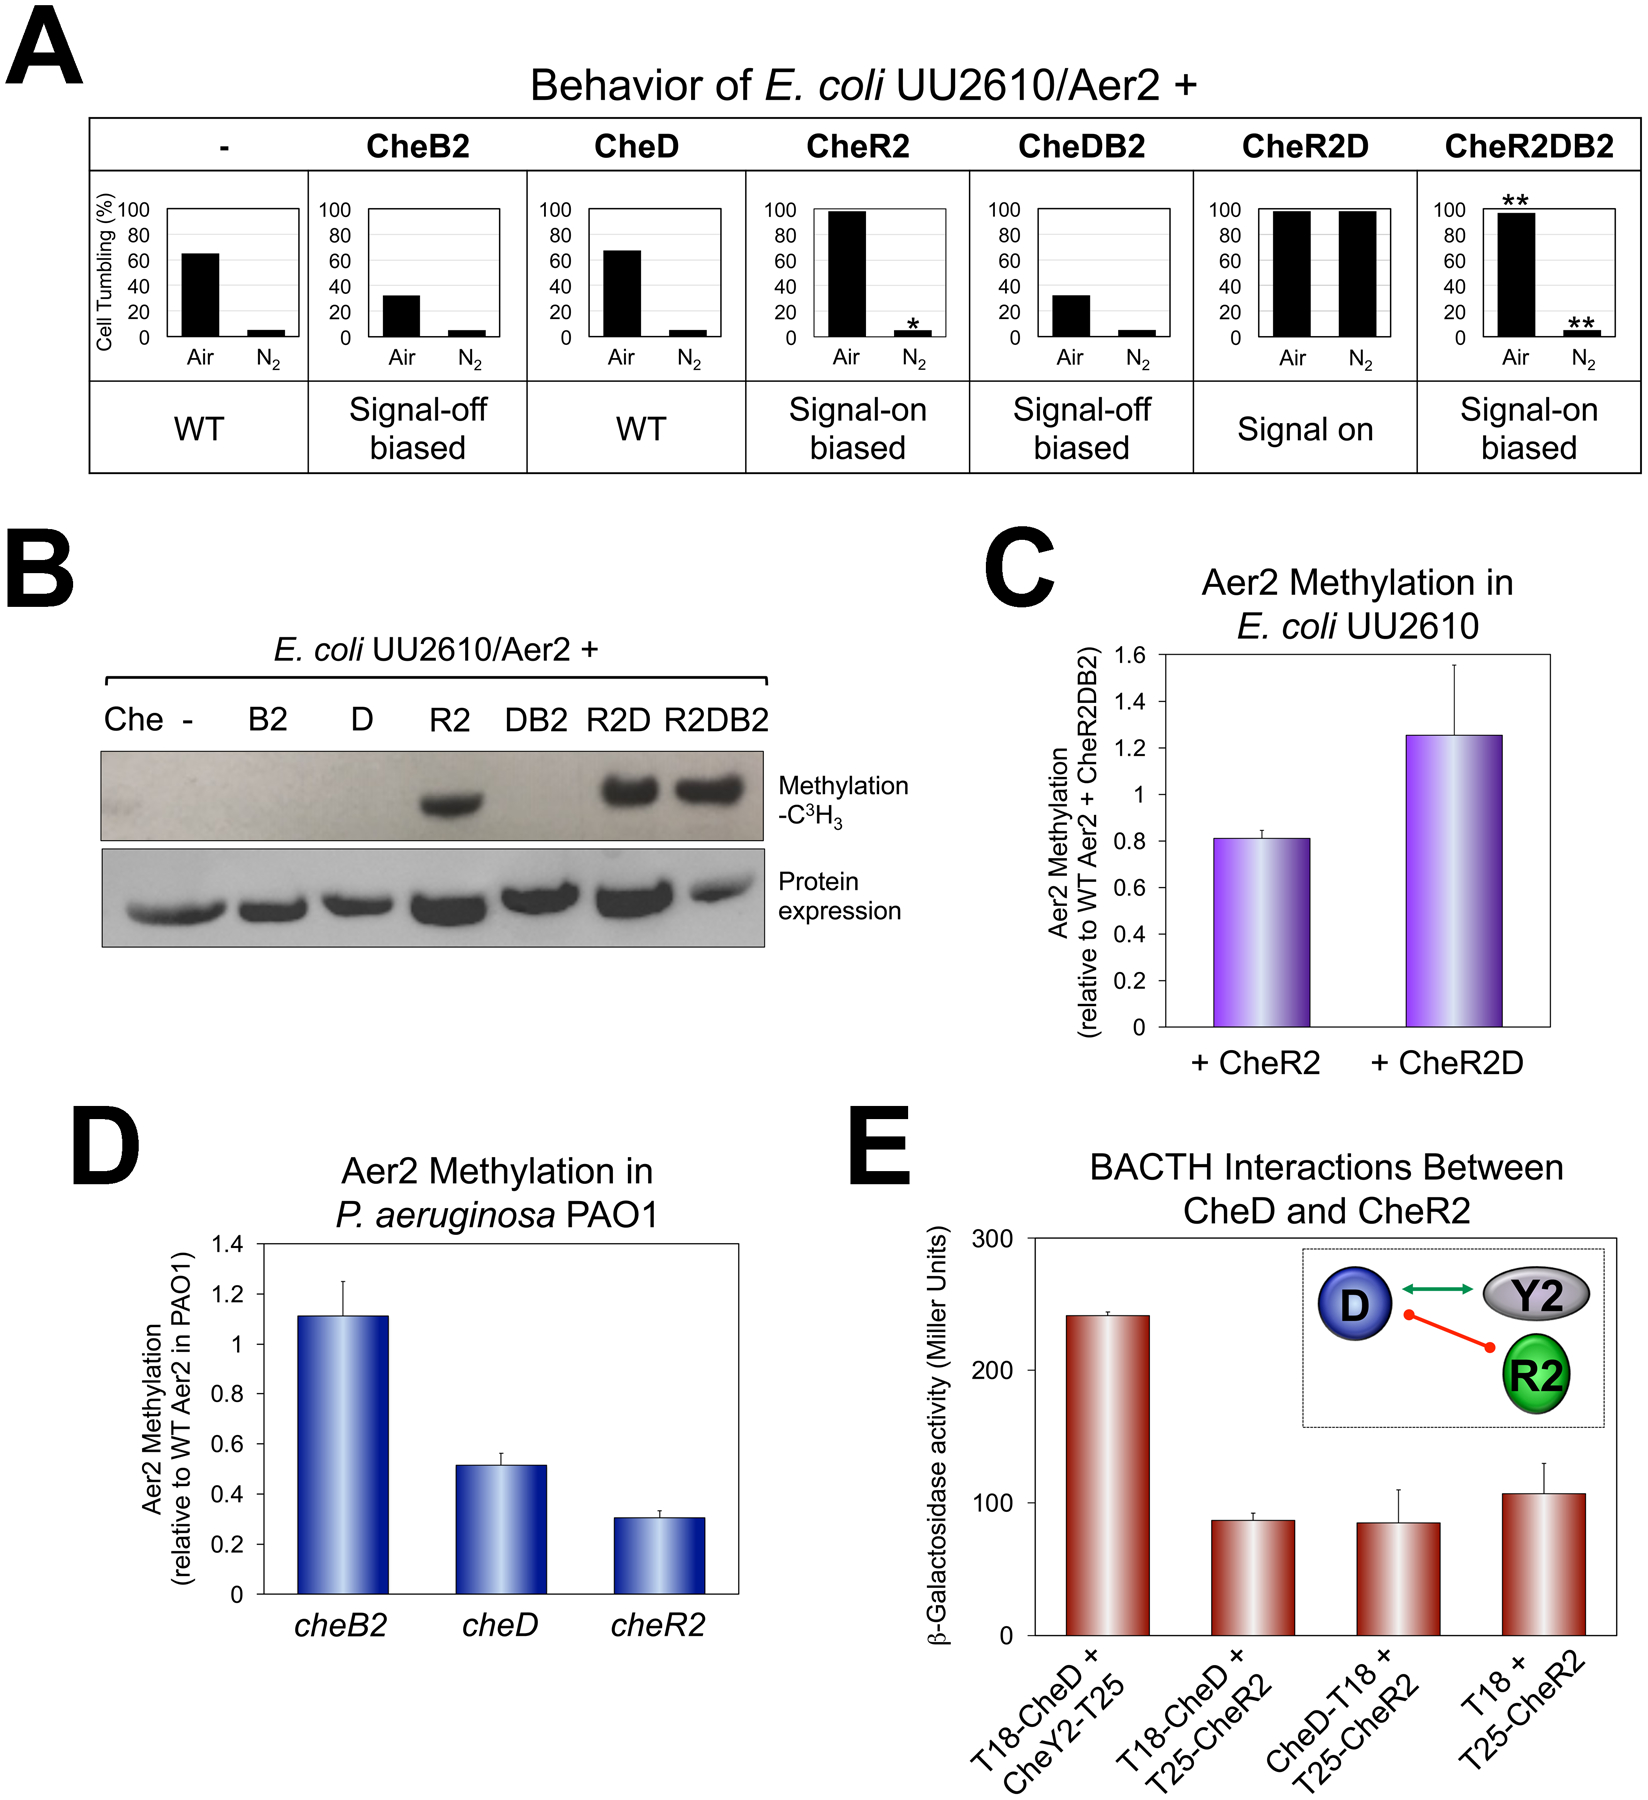
Fig. 6. Behavior and methylation of WT Aer2 (Aer2QEEE) in vivo in the presence or absence of the CheB2, CheD and CheR2 adaptation enzymes.

A. Average percent of E. coli UU2610 cells tumbling in the presence of Aer2 and different combinations of CheB2, CheD and CheR2. Percentages represent steady-state tumbling in air and in N2 30 sec after switching to air or N2. CheR2 had a 15 sec delayed smooth-swimming response in N2, which is indicated by an asterisk. CheR2DB2 had a faster smooth-swimming response in N2 (5 sec to smooth-swimming, versus 12 sec for WT), and a slower tumbling response in air (18 sec to tumble versus 7 sec for WT). These are indicated by double asterisks.
B. Methylation of Aer2 in E. coli UU2610 in the presence of different combinations of CheB2, CheD and CheR2 [upper panel, L-(methyl-3H) methionine], and protein expression (lower panel, HisProbe Western blot).
C. Average Aer2 methylation extent in E. coli UU2610 in the presence of CheR2 or CheR2D compared with Aer2 methylation in the presence of CheR2DB2. Error bars represent the standard deviation from three independent experiments. Although Aer2 was more methylated in the presence of CheR2D compared with CheR2 alone, the difference was not highly significant (P = 0.065).
D. Average Aer2 methylation extent in P. aeruginosa PAO1 lacking either CheB2, CheD or CheR2 [all results were significantly different from each other (P < 0.05)]. Error bars represent the standard deviation from three independent experiments.
E. BACTH interactions between CheD and CheR2 in E. coli BTH101 as quantified in β-galactosidase assays (shown as the mean and standard deviation from three independent experiments) and summarized in the inset. The green arrow links interacting proteins, whereas the red line indicates no protein interaction.
