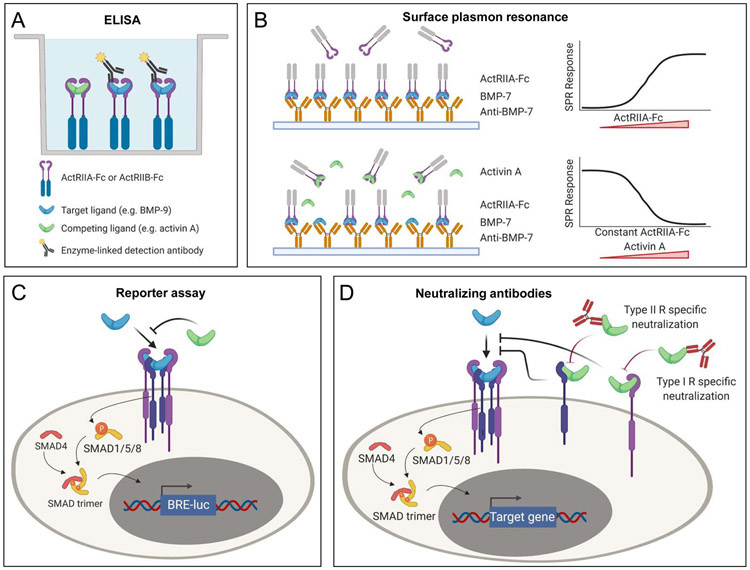
Figure 5. Methods to measure ligand competition.
A. ELISA measures levels of ligand captured using Fc-fusion receptors (ActRIIA-Fc, ActRIIB-Fc). Binding of ligand (here BMP-9) is detected with a target-ligand specific, enzyme-conjugated antibody (here anti-BMP-9). A competing ligand (here activin A) is not detected by the that antibody. Competition between activin A and BMP-9 therefore presents as an activin A concentration dependent reduction in the target-specific antibody signal. B. Surface plasmon resonance (SPR) can directly measure competition between ligands for binding to a receptor. Here, a BMP-7 antibody that targets the type I receptor binding site is immobilized and BMP-7 is captured by this antibody. ActRIIA-Fc binds to the captured BMP-7. ActRIIA-Fc is incubated with varying concentrations of activin A. Competition between BMP-7 and activin A presents as an activin A concentration dependent decrease in ActRIIA-Fc binding to captured BMP-7. C. Cell-based assays measure the effect of competition on SMAD signaling via SMAD responsive luciferase reporters. Luciferase activity correlates with SMAD activity. Here, competition between BMP-7 and activin A presents as an activin A concentration dependent decrease in the BMP-7 mediated SMAD1/5/8 signal. D. Antibodies and inhibitors that specifically block the type II or type I receptor binding sites help elucidate the molecular basis for ligand competition.

