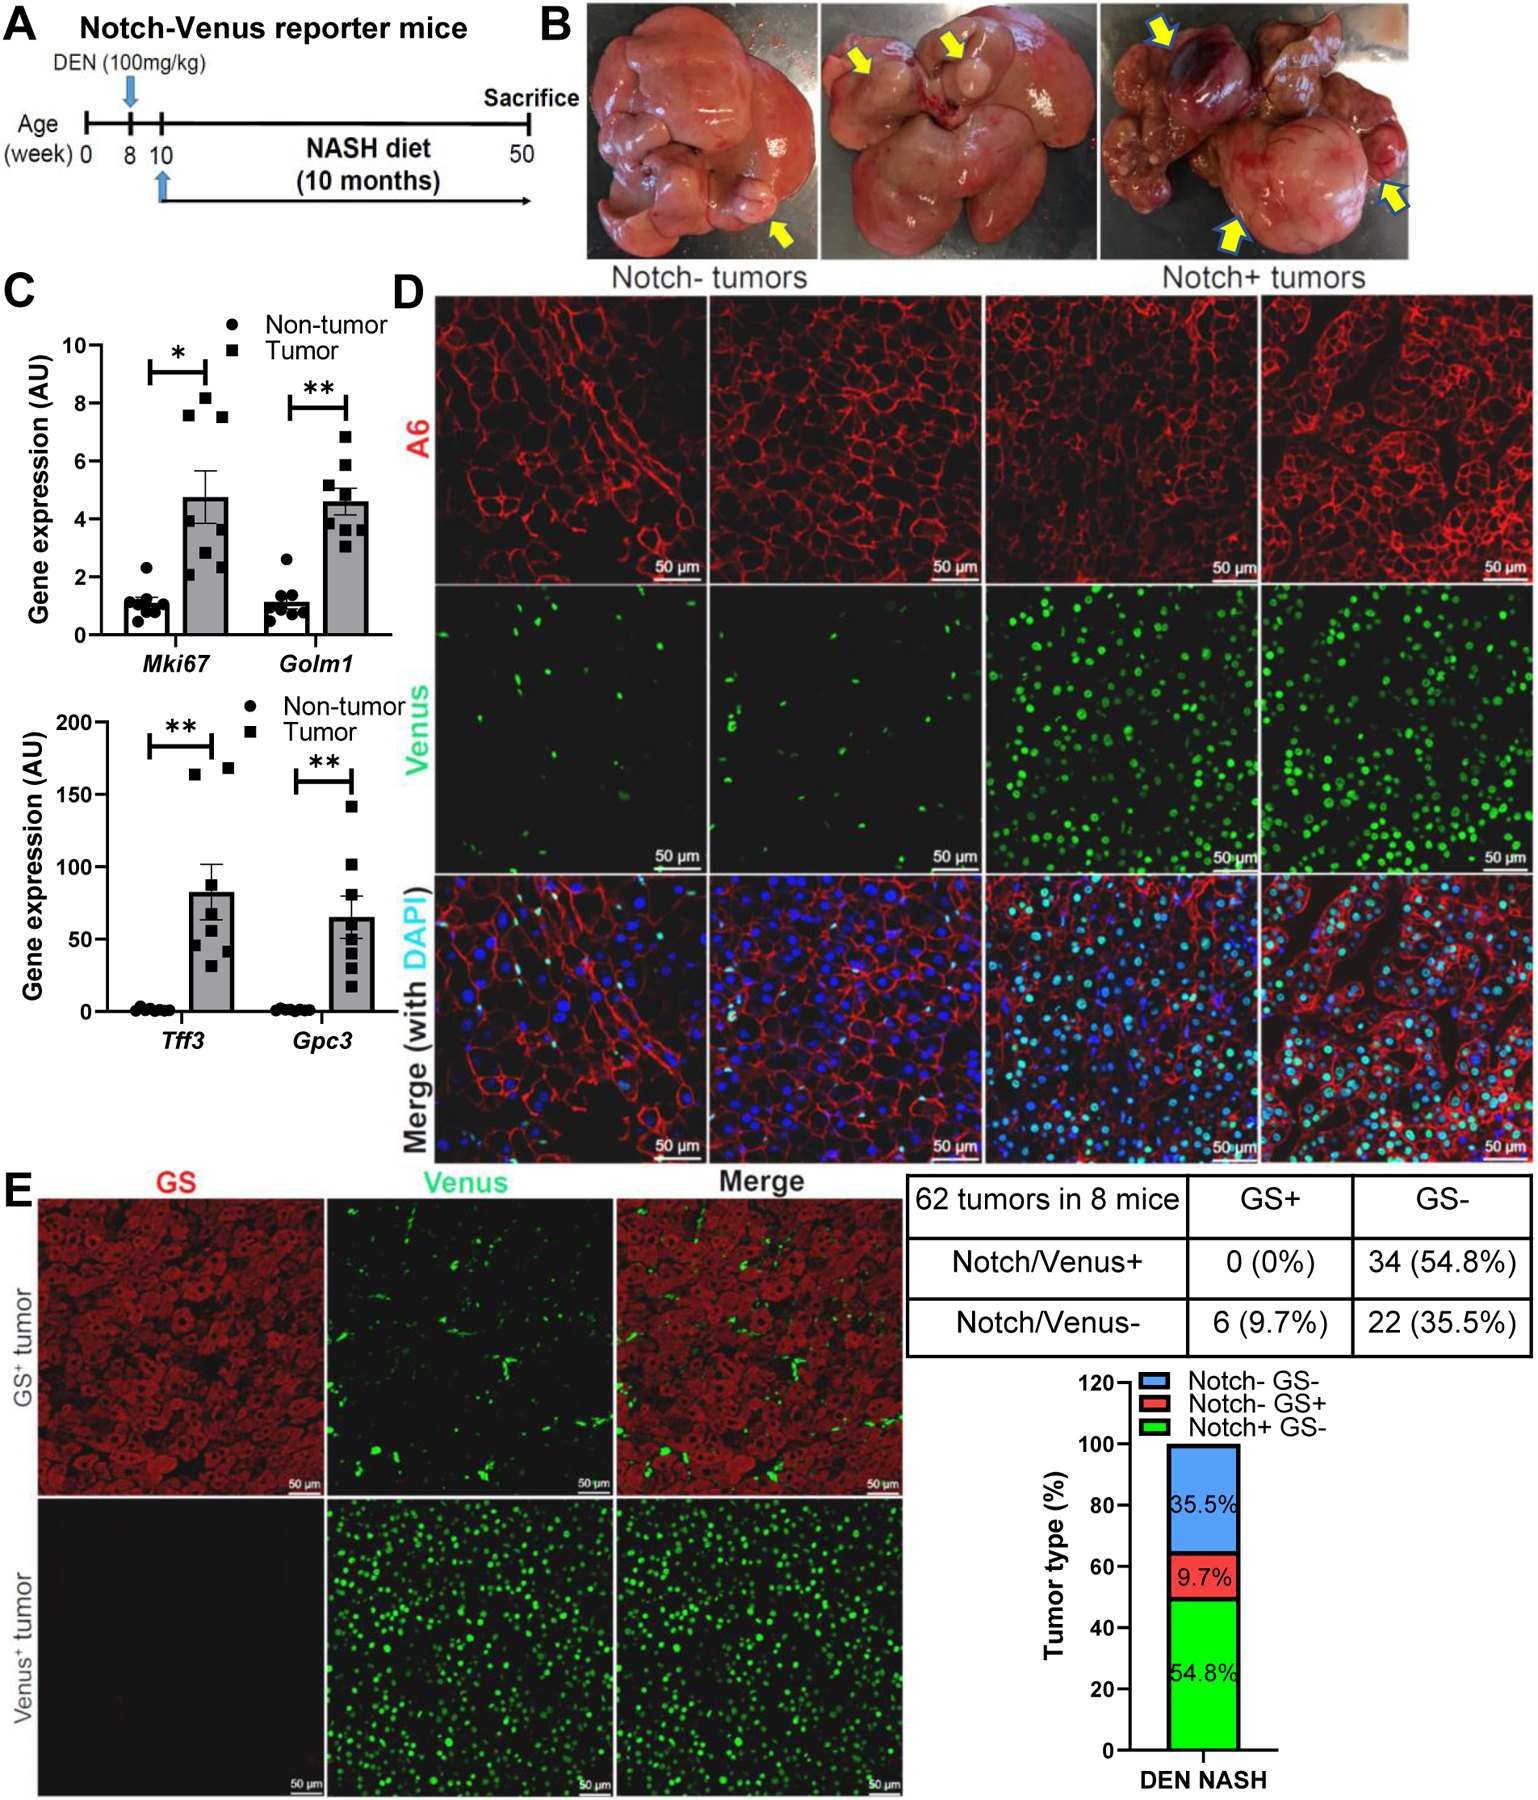
Fig. 4. Notch and β-catenin activity mark distinct carcinogen-induced HCC subsets.

(A) Notch-Venus reporter mice were dosed with diethylnitrosamine (DEN, 100 mg/kg), then fed NASH diet for 10 months prior to sacrifice. (B) Representative images of liver tumors, and (C) Non-tumor and Tumor expression of HCC marker genes in Notch-Venus mice (n = 8 per group). (D) Representative images of A6 (red), Venus (green), and DAPI (blue) co-staining in Notch-negative and –positive tumors from Notch-Venus mice. (E) Representative images of β-catenin target glutamine synthetase (GS, red) and Venus (green) co-staining in GS+ and Venus+ tumors from Notch-Venus mice, with quantification of GS+ and/or Notch/Venus+ tumors. *, P < 0.05 and **, P < 0.01 as compared to the non-tumor group by two-tailed t tests. AU, arbitrary unit. Data are shown as means ± SEM.
