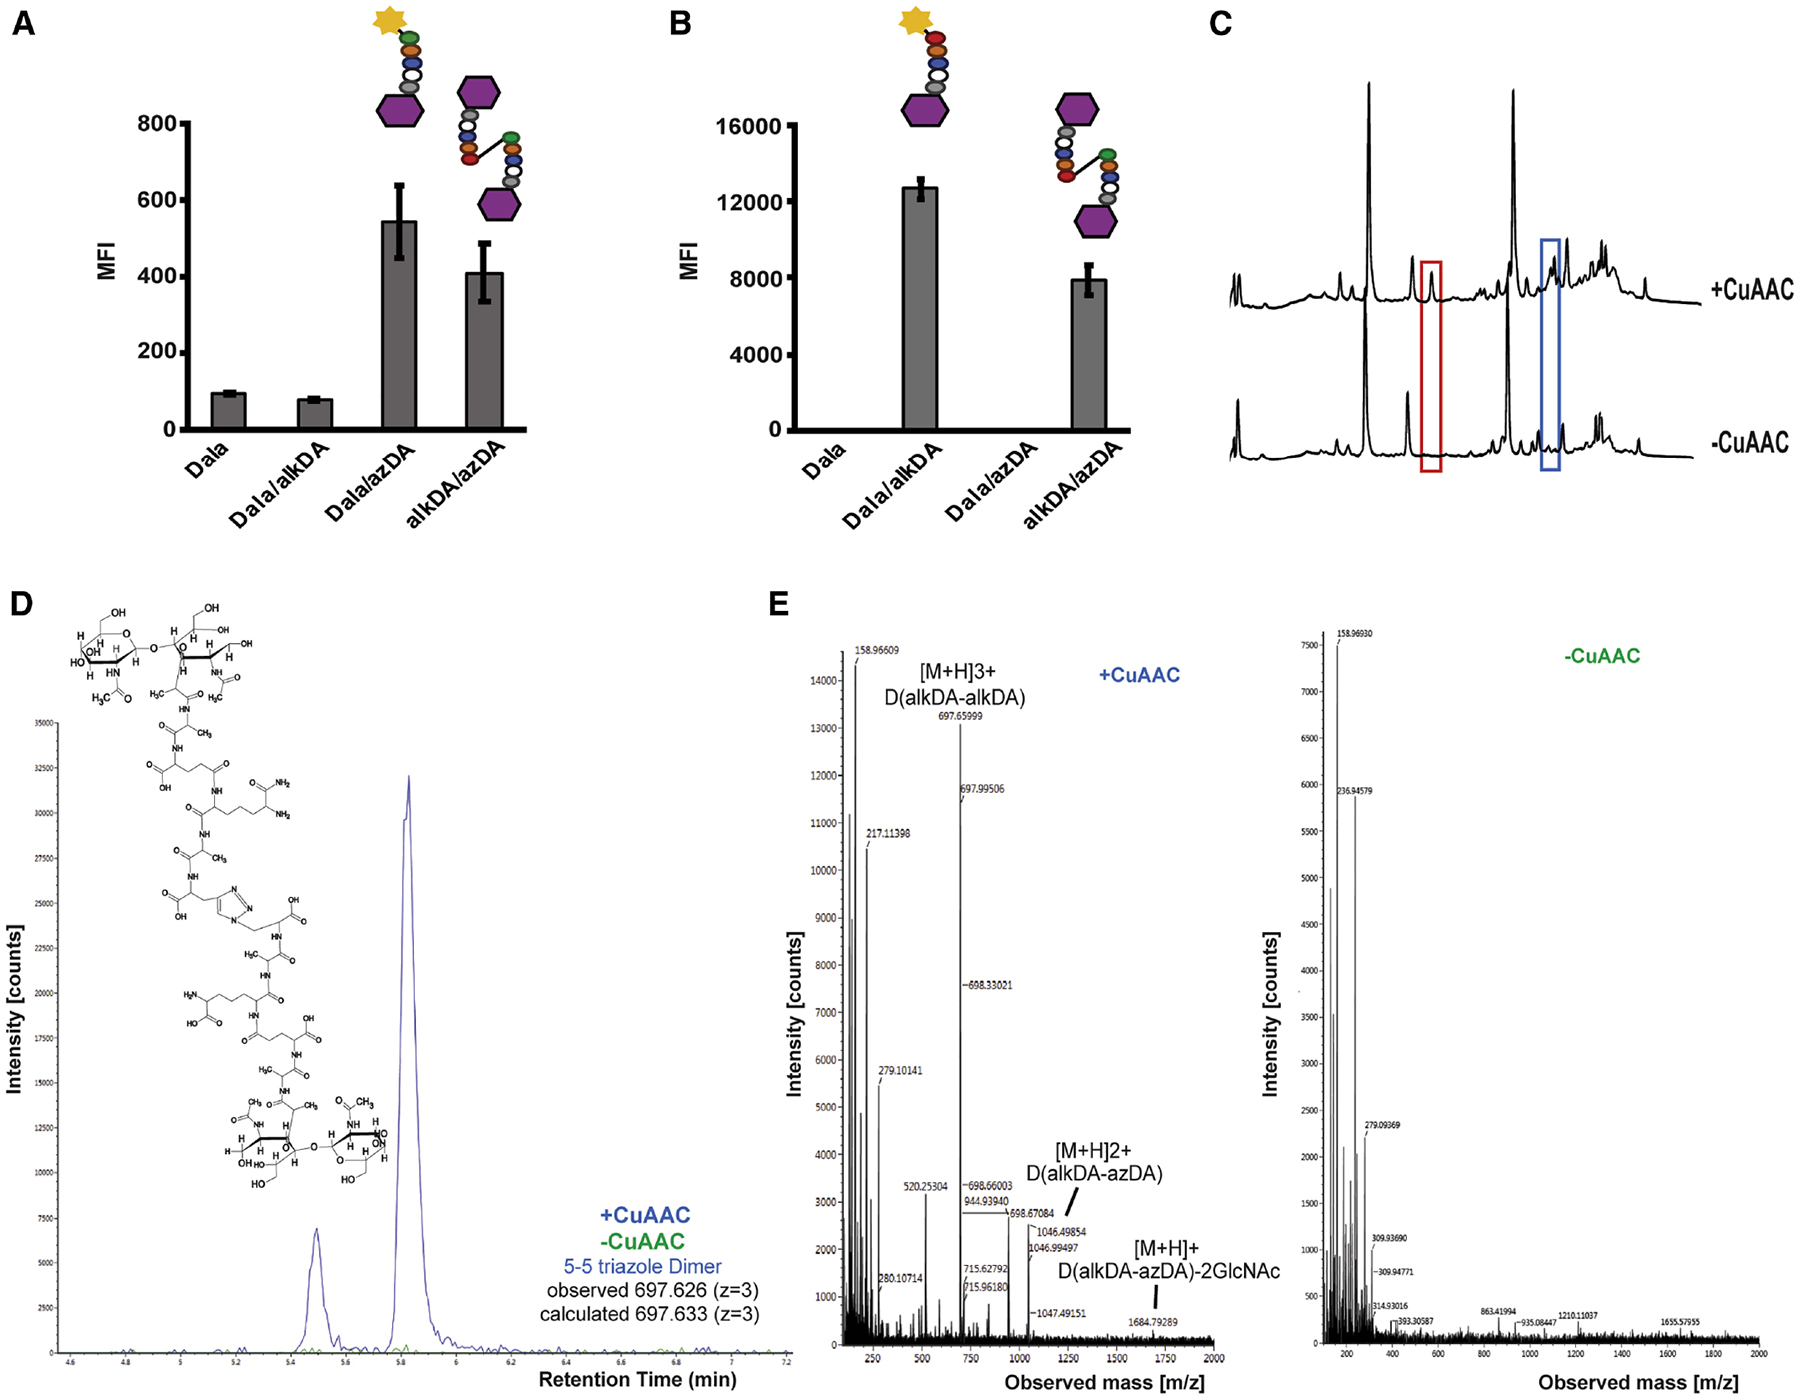
Figure 2. Indirect (A-B) and direct (C-E) identification of synthetic triazole cross-links.

CS802–2 E. coli was incubated +/− d-alanine alone (Dala) or equimolar combinations of d-alanine, azido-d-alanine (azDA), and alkynyl-d-alanine (alkDA) as indicated, washed and subjected to CuAAC with BTTP ligand and complementary fluorophore (A-B) or with the detection reagent omitted (C-E). Peptidoglycan was extracted, digested with mutanolysin and lysozyme, and separated by ultra-performance liquid chromatography (UPLC). We identified several peaks from alkDA/azDA-labeled bacteria that were specific to CuAAC treatment (red and blue boxes, (C)). Chemical structure for 5–5 triazole dimer (D) identified by mass spectrometry (MS) from red boxed peak in (C). (E) Ion detection (left) and MS profile (right) for 5–5 triazole dimer. MS/MS profile and fragmentation shown in Figure S4 and Table S1, respectively. Ion detection and MS profiles for 5–5 triazole trimers and tetramer from blue boxed peaks in (C) shown in Figure S5. Fluorescence in (A-B) was quantified by flow cytometry and data are representative of 2–6 biological replicates performed in triplicate. MFI, mean fluorescence intensity. Error bars, +/− standard deviation. UPLC analysis in (C) was performed on two biological replicates.
