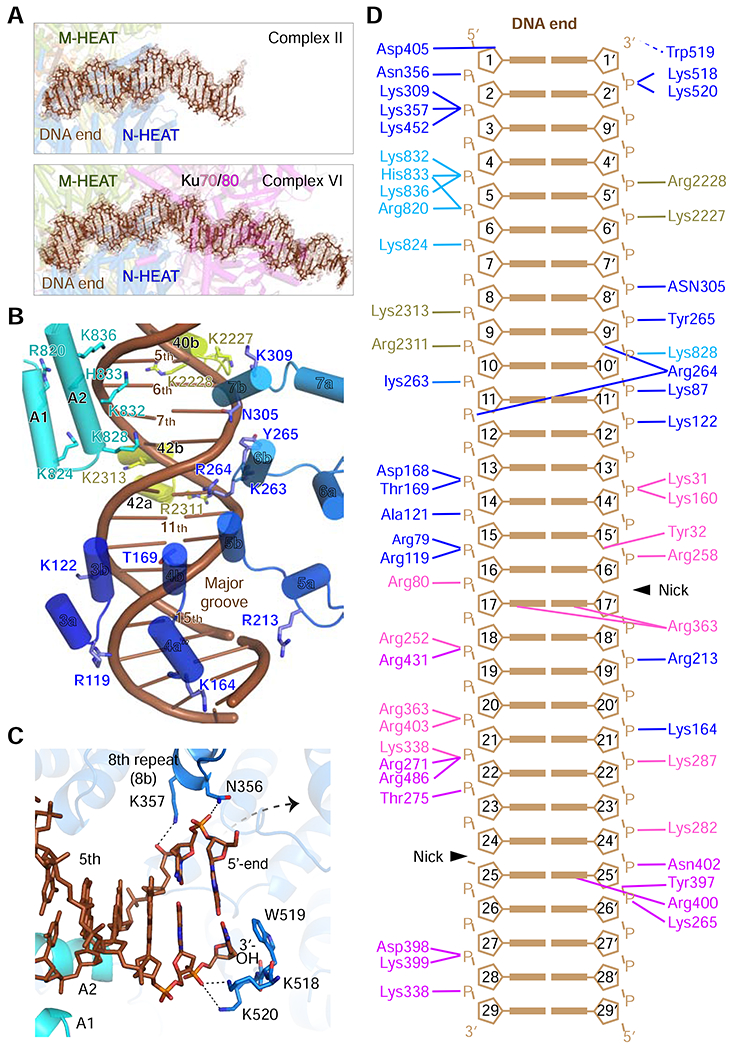
Figure 3.

DNA binding by DNA-PK.
(A) Representative density maps of the DNA in complexes II and VI were contoured color at 5.5 and 5.0 σ, respectively, in brown. Ku stabilizes the DNA in complexes III-VI.
(B) Interactions between the DNA and NH1, the extension of the 16th helical repeat (A1, A2) and MH3 in complexes II-VI. Helices A1 and A2 are not docked onto DNA in complex I. Residues of DNA-PKcs at the interface with DNA are shown as sticks and labeled.
(C) In complexes III-VI, DNA-PKcs recognizes both DNA strands and caps the 3′ end specifically. Accommodation of a 5’-overhang is indicated by a dashed arrow.
(D) Diagram of the complete DNA interactions made by DNA-PKcs and Ku in complex VI.
