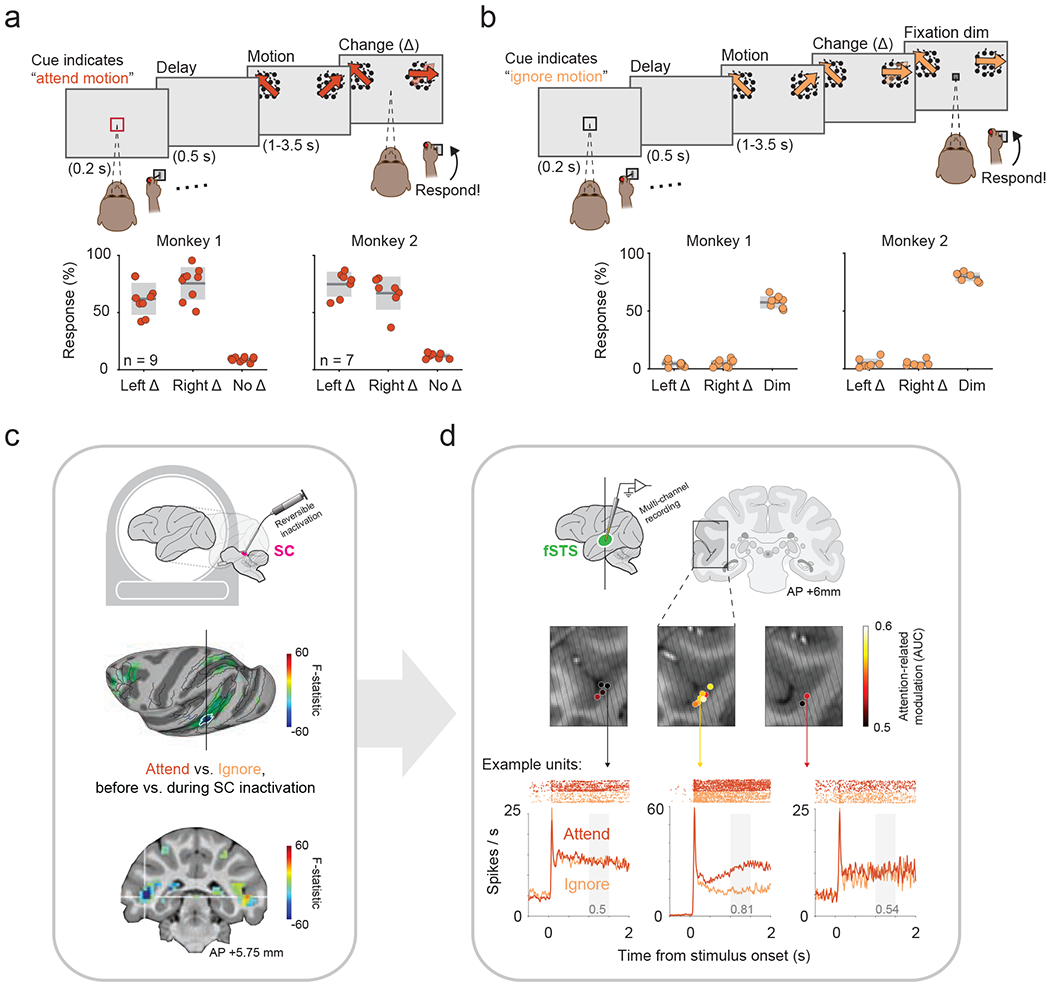
Figure 1. Identification of the fSTS region as dependent on SC activity.

a. Top: Red cue instructed monkey to attend motion stimuli and report changes in motion direction (Δ). Bottom: response rates for left and right Δ (hits) and “no-Δ” (catch) trials. Individual sessions are plotted over gray box indicating mean ± sd.
b. Top: Black cue instructed monkey to ignore motion-changes and report a dim in fixation spot. Bottom: response rates for left and right Δ (false alarms) and for dim (hits). Same format as a.
c. Functional activations with and without SC inactivation identified a circumscribed region (blue colored patch outlined in white) in fSTS whose modulation was the most dependent on SC activity.
d. Coronal slices of the fSTS are overlaid with average attention-related modulation (measured as AUC, see Methods) across neurons recorded in each location (colored spots). Oblique lines indicate electrode approach. Bottom: Example neuronal responses to Attend and Ignore conditions and their corresponding modulation values (gray text), from three recording locations exhibiting poor (left example), good (center), and intermediate (right) attention-related modulations.
