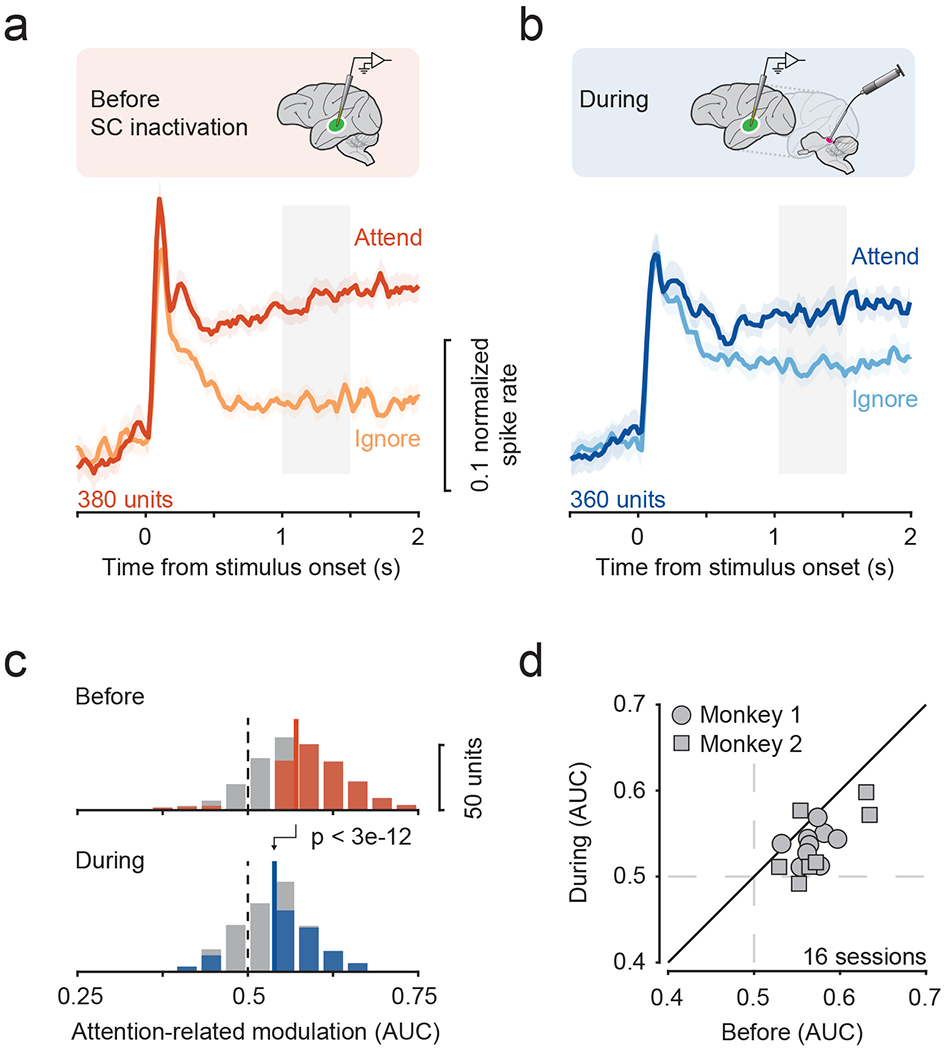
Figure 2. Attention-related modulation in fSTS depends on SC activity.

a, b. Population average of the normalized responses to motion stimulus in Attend and Ignore conditions before (a) and during (b) SC inactivation. Error bars indicate 68.2% CI. Grey window indicates time period used for computing attention-related modulation.
c. Distribution of attention-related modulation values across neurons before (median = 0.57) and during SC inactivation (median = 0.54). Solid and dotted lines indicate median and no modulation, respectively. Colored shading indicates significance for individual neurons (p < 0.05, bootstrap test).
d. Average attention-related modulation across simultaneously recorded neurons within a session (mean ± sd = 23.75 ± 8.72), before and during SC inactivation.
See also figures S1–S5.
