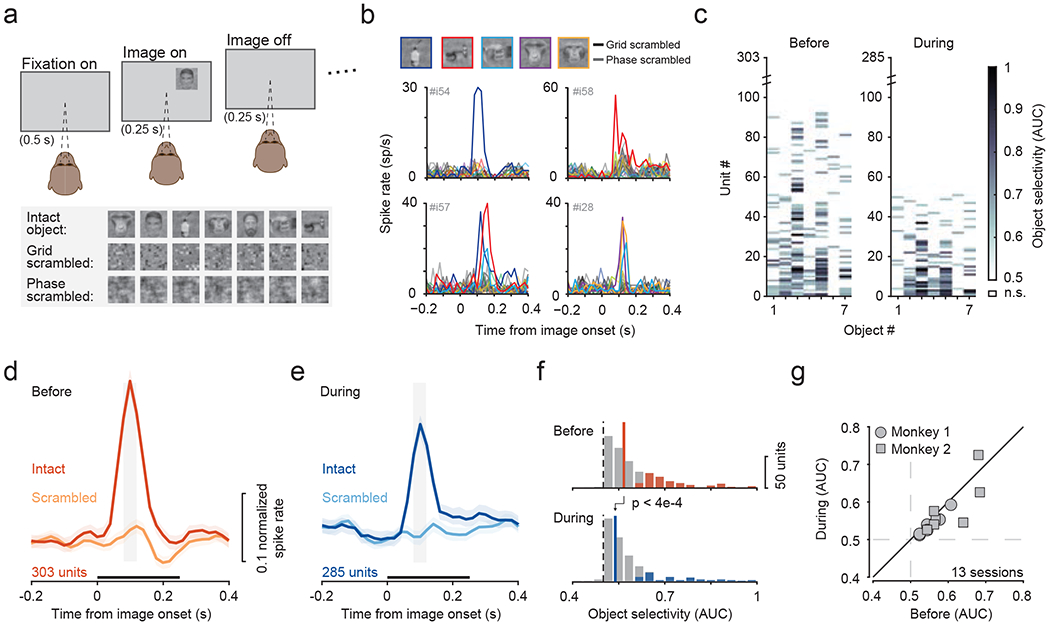
Figure 6. Object selectivity in fSTS neurons depends on SC activity.

a. Monkeys fixated a central spot while either object, grid-scrambled, or phase-scrambled images were presented.
b. Example neurons that responded selectively to individual object images.
c. Object selectivity values for individual neurons, sorted by number of objects selective for, before and during SC inactivation. Non-significant (n.s.) selectivity (p > 0.05, bootstrap test) is shown as white.
d, e. Population average of normalized responses to the most selective object and the corresponding scrambled object, before (d) and during (e) SC inactivation. Grey window indicates time period used for computing object selectivity. Black bar above abscissa indicates the duration of image presentation. Error bars: 68.2% CI.
f. Distribution of object selectivity values before (median = 0.57) and during SC inactivation (median = 0.55). Solid and dotted lines indicate median and no selectivity, respectively. Colored shading indicates significance for individual neurons (p < 0.05, bootstrap test).
g. Effect of SC inactivation on object-selectivity across sessions.
See also figure S6.
