Figure 7.
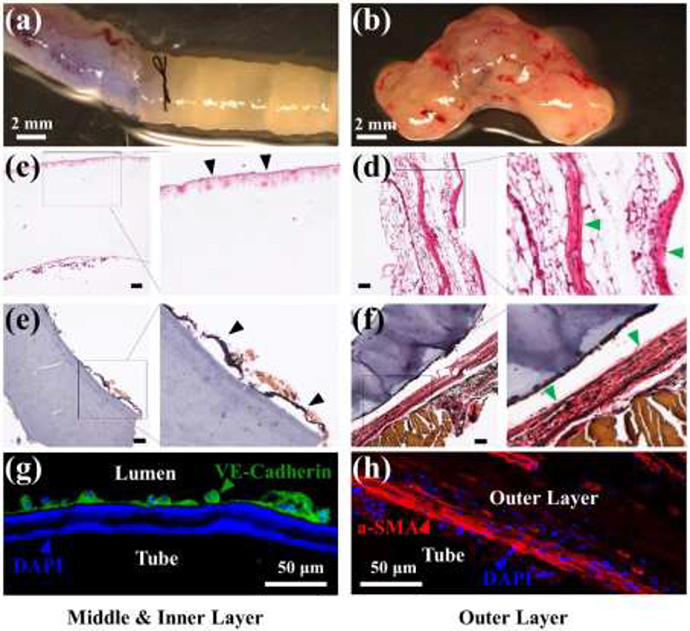
In vivo remodeling of a vascular graft made of a c-PGDA tube which was thermally cured for 6 hours. Macroscopic images of the printed tube immediately after (a) and 14 days after (b) being anastomosed to a mouse aorta. H&E staining of the middle/inner (c) or outer layers (d) of a newly formed tissue after 14 days post-transplantation. Black arrows indicate the migration of cells into out layers and green arrows indicate potential adventitia growth. EVG staining of the middle/inner (e) or outer layers (f) of neo-tissue 14 days after tube grafting. Black arrows indicate inner elastin layer and green arrows indicate outer elastin layer. Scale bars for (c)-(f): 100 μm. (g) Image showing endothelial cells stained with VE-cadherin antibody (green). (h) Immunostaining of myofibroblast marker α-SMA (red, arrow). For (g) and (h), cell nuclei were stained with DAPI (blue).

