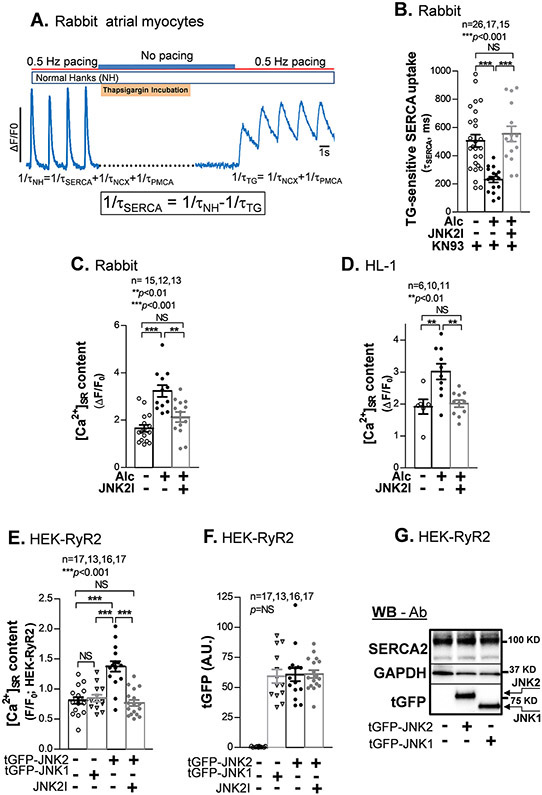
Figure 1.
JNK2, but not JNK1 increases SR Ca2+ uptake and load. A) An example trace of the thapsigargin (TG)-sensitive SERCA uptake confocal measurement protocol. B) Summarized data showing shortened tau of TG-sensitive Ca2+ removal by SERCA2, reflecting an increased SR Ca2+ uptake, in alcohol (Alc)-exposed rabbit atrial myocytes (in the presence of 1 μM CaMKII inhibitor KN93 to inhibit JNK2-driven diastolic leak) compared to controls. JNK2 inhibition by 170 nM JNK2 inhibitor (JNK2I) reverses the uptake to normal levels seen in controls. C-D) Pooled data of increased [Ca2+]SR load (measured with 10 mM caffeine-induced Ca2+-released transients) in alcohol-exposed rabbit atrial myocytes and HL-1 myocytes; JNK2 specific inhibition by JNK2 inhibitor (JNK2I) completely prevented this alcohol-elevated [Ca2+]SR load. E) Pooled data of a higher [Ca2+]SR load (caffeine-induced Ca2+ transients) in tGFP-JNK2 positively expressed HEK-RyR2 cells (tGFP-JNK2) compared to tGFP-JNK1 positive cells (tGFP-JNK1) and sham controls; the JNK2 action in [Ca2+]SR load is completely eliminated by the JNK2 inhibitor (JNK2I) treatment. F) Summarized quantitative data of tGFP fluorescence intensity from those imaged HEK-RyR2 cells with positively expressed tGFP-JNK1 and tGFP-JNK2 cells and no tGFP in non-transfected controls (Sham). All quantified tGFP-JNK1 and tGFP-JNK2 fluorescence signals were subtracted to non-specific fluorescence background in non-transfected sham control cell images. G) Representative immunoblotting images (reflecting the mean values of quantitative data) showing a similar expression amount of endogenous SERCA2 and exogenous JNK2 and JNK1 proteins (detected by the tGFP antibody) in tGFP-JNK1 and tGFP-JNK2 transfected HEK-RyR cells vs non-transfected controls (Sham).

