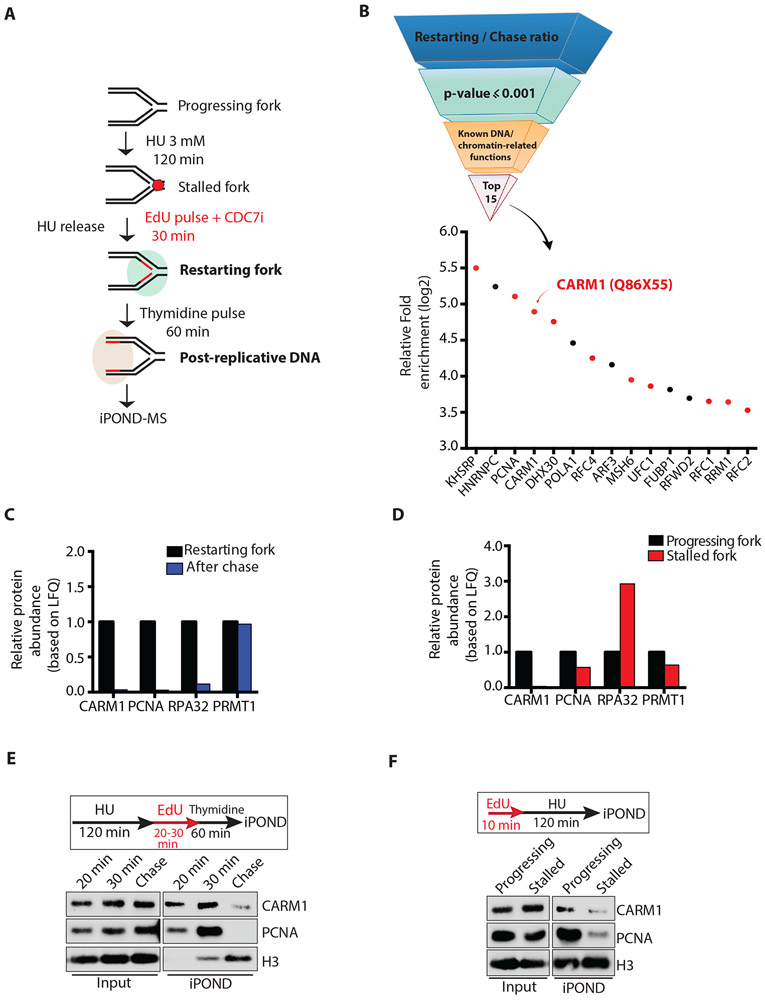
Figure 1. CARM1 associates with progressing and restarting replication forks.
(A) A schematic of the iPOND-MS approach to identify proteins associating with restarting replication forks. The CDC7i PHA-767491 was used at 10 μM. To identify proteins at progressing forks and stalled forks, cells were labeled with EdU for 10 min, or were labeled with EdU for 10 min followed by incubation in 3 mM HU for 120 min. (B) A pipeline to identify the proteins that are enriched at restarting replication forks. Proteins were ranked according to the log2 ratio of LFQ intensities at restarting forks and on post-replicative DNA, and then selected by the cutoff of p-value ≤ 0.001 (LogProb=3). The top 15 proteins with known DNA or chromatin-related functions are shown. Red dots represent the proteins confirmed to be enriched at restarting forks in an independent iPOND-MS analysis. (C) Relative protein abundance based on LFQ intensities of CARM1, PCNA, RPA32 and PRMT1 protein at restarting forks and on post-replicative DNA after thymidine chase. The relative abundance of each protein at restarting forks was defined as 1. (D) Relative protein abundance based on LFQ intensities of CARM1, PCNA, RPA32 and PRMT1 at progressing forks and stalled forks. The intensity of each protein at progressing forks was defined as 1. (E) Proteins associating with restarting forks and post-replicative DNA were captured by iPOND and analyzed by Western blot. (F) Proteins associating with progressing forks and stalled forks were captured by iPOND and analyzed by Western blot.

