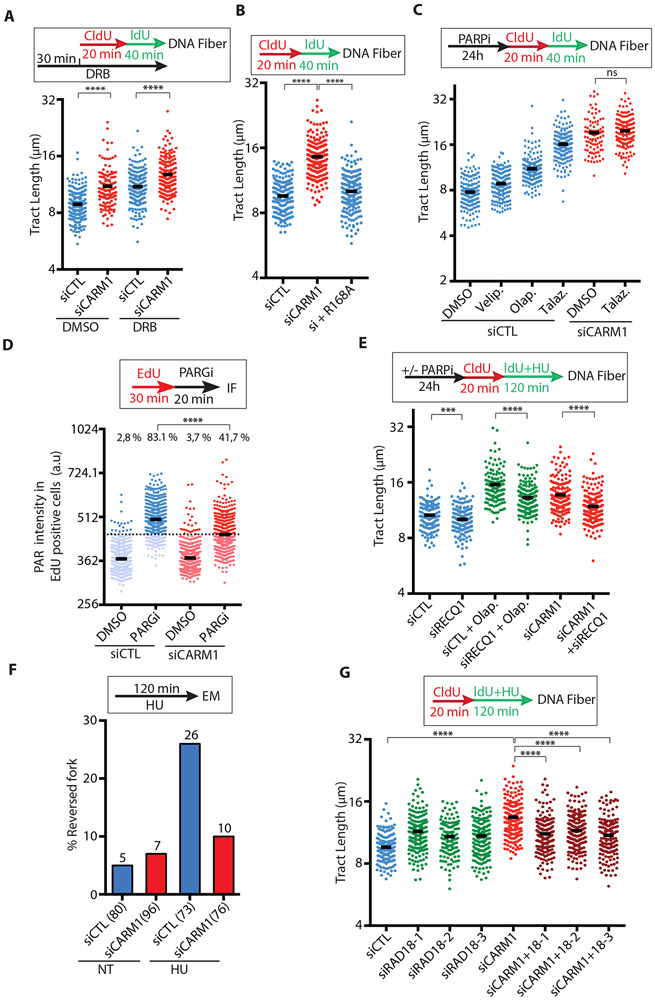
Figure 3. CARM1 functions with PARP1 to slow replication forks.
(A) MCF10A cells were transfected with control or CARM1 siRNA. Two days after transfection, cells were treated with DMSO or 100 μM DRB for 30 min, and then analyzed by DNA fiber assay as indicated. The length of replication tracts (n ≥135) was measured. Black bars indicate the mean length. Statistical significance was determined by Mann-Whitney test: (****) P<0.0001. (B) MCF10A cells that inducibly express the methyltransferase inactive CARM1 mutant (CARM1R168A) were transfected with control or CARM1 siRNA for 48h. One day after transfection, cells were treated with 10 ng/mL doxycycline to induce CARM1R168A expression for 24h. Cells were analyzed by DNA fiber assay as indicated. The length of replication tracts (n=200) was measured. Statistical significance was determined by Mann-Whitney test: (****) P<0.0001. (C) MCF10A cells were transfected with control or CARM1 siRNA for 48h. One day after transfection, cells were treated with 10 μM Veliparib (Velip.), Olaparib (Olap.), or Talazoparib (Talaz.) for 24h. Cells were analyzed by DNA fiber assay as indicated. The length of replication tracts (n ≥95) was measured. Statistical significance was determined by Mann-Whitney test: (ns) not significant. (D) U2OS cells were transfected with control or CARM1 siRNA. Two days after transfection, cells were labeled with EdU for 30 min then treated with 1 μM PARGi (PDD00017273) for 20 min. Levels of PAR immunofluorescence intensity in individual EdU-positive cells (n≥703) were quantified. Black bars indicate the mean PAR intensity; (a.u.) Arbitrary unit. A threshold is set at 446 a.u. above 97% of the control siRNA-transfected and DMSO-treated cells, and the fraction of cells above this threshold in each cell population was quantified. Statistical significance was determined by Mann-Whitney test: (****) P<0.0001. (E) MCF10A cells were transfected with control, CARM1, and RECQ1 siRNAs for 48h as indicated. One day after transfection, the indicated cells were treated with 10 μM PARPi (Olaparib) for 24h. Cells were analyzed by DNA fiber assay as indicated. HU (200 μM) was used during IdU labeling. The length of replication tracts (n ≥126) was measured. Statistical significance was determined by Mann-Whitney test: (****) P<0.0001; (***) P<0.001. (F) U2OS cells were transfected with control or CARM1 siRNA. Two days after transfection, cells were treated with 4 mM HU for 120 min and analyzed by electron microscopy (EM). The percentage of reversed forks is shown above each sample. The total number of forks analyzed is shown below each sample in brackets. (G) MCF10A cells were transfected with control, CARM1, and RAD18 siRNAs for 48h and analyzed by DNA fiber assay as indicated. HU (200 μM) was used during IdU labeling. The length of replication tracts (n ≥127) was measured. Statistical significance was determined by Mann-Whitney test: (****) P<0.0001.

