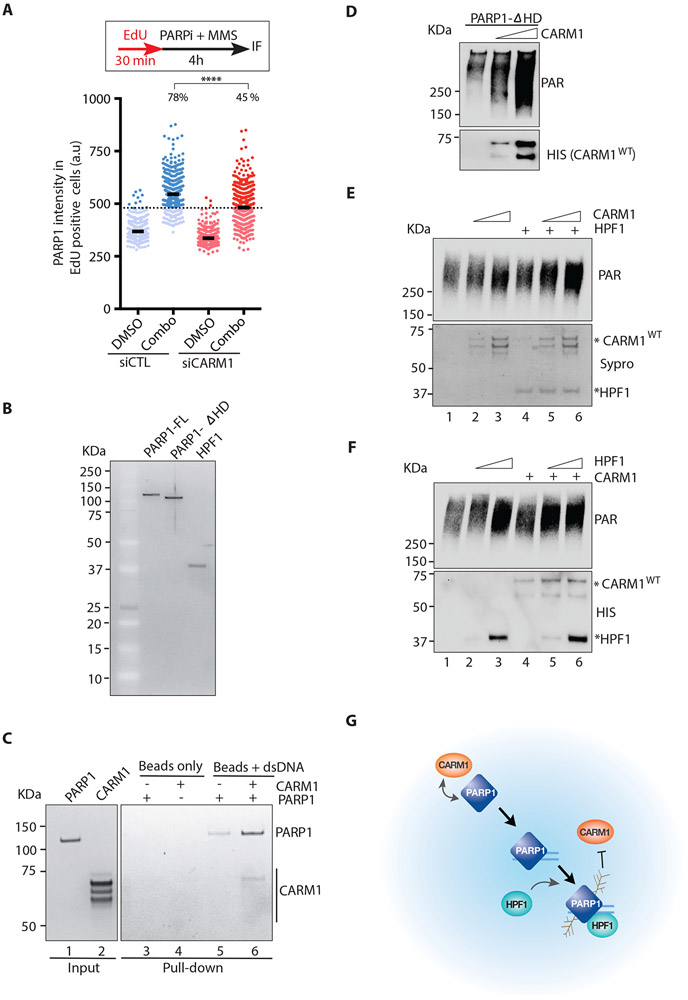
Figure 7. CARM1 acts in concert with HPF1 to activate PARP1.
(A) U2OS cells were transfected with control or CARM1 siRNA. Two days after transfection, cells were labeled with EdU for 30 min and then treated with 10 μM PARPi (Olaparib) and 0.01% MMS for 4 h. Cells were extracted with detergent, and the immunofluorescence intensity of chromatin-bound PARP1 in individual EdU-positive cells (n=527) were quantified. Black bars indicate the mean intensity; (a.u) Arbitrary unit. A threshold is set at 480 a.u. above 97% of the control siRNA-transfected and DMSO-treated cells, and the fraction of cells above this threshold in each cell population was quantified. Statistical significance was determined by Mann-Whitney test: (****) P<0.0001 (B) Purified proteins (10 ng) of full-length PARP1 (FL), the PARP1-ΔHD mutant, and HPF1 were run on an SDS-PAGE and stained with Sypro Ruby. (C) DNA-binding of PARP1 was analyzed using biotinylated dsDNA (60 nt) conjugated to streptavidin magnetic beads (M280). PARP1 (10 nM) (lane 1) and CARM1 (30 nM) (lane 2) were incubated with beads alone or beads carrying dsDNA as indicated. The PARP1 and CARM1 captured by beads were analyzed by Sypro Ruby staining. (D) In vitro PARP1 activation assay with purified PARP1-ΔHD (5 nM), NAD+ (250 μM), and dsDNA (25 μg/mL). Increasing concentrations (12-25 nM) of CARM1 were added to reactions. Levels of PAR and CARM1 were analyzed by Western blot with the indicated antibodies. (E) In vitro PARP1 activation assay with purified PARP1 (1 nM), NAD+ (250 μM), and dsDNA (25 μg/mL). CARM1 (10-20 nM) and HPF1 (10 nM) were added to reactions as indicated. Levels of PAR were analyzed by Western blot. The HPF1 and CARM1 used in the reactions were analyzed by Sypro Ruby staining. (F) In vitro PARP1 activation assay was performed and analyzed as in (E) except that HPF1 (10 −20 nM) and CARM1 (20 nM) were added to reactions as indicated. Levels of PAR, CARM1 and HPF1 were analyzed by Western blot (G) A model for concerted functions of CARM1 and HPF1 in activating PARP1.

