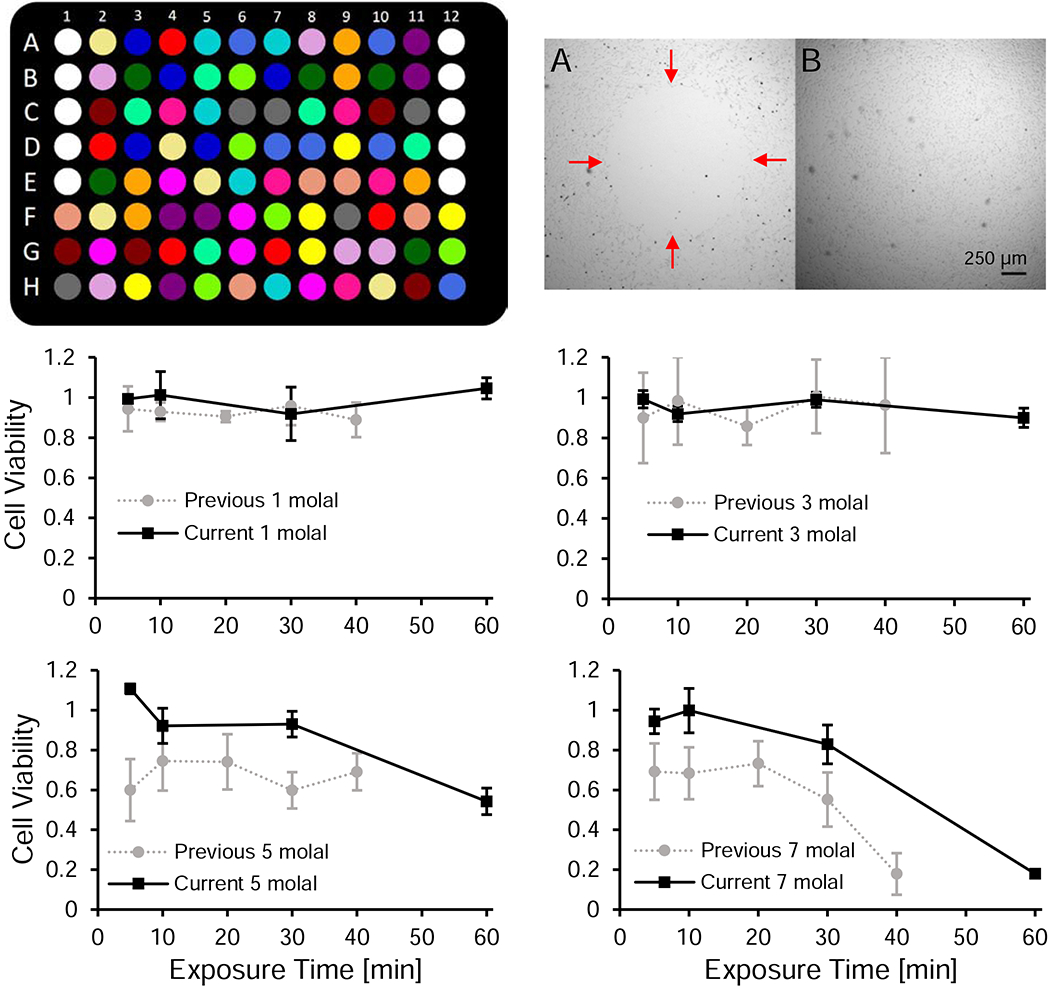
Figure 3.

Automated liquid handling reduces experimental variability and enables high-throughput measurement of CPA toxicity. Top left panel: schematic of a randomized 96-well plate map. The cell-free media controls (white wells) are in A1-E1 and A12-E12. The remaining wells are seeded with cells and treatments are randomly distributed throughout the rest of the plate. These include the positive controls (dark green), negative controls (red), and CPA treatments (15 unique colors). Top right panel: side by side comparison of a cell monolayer before (A) and after (B) optimizing the pipetting settings. There is a distinct hole in the monolayer in the before image with red arrows indicating the boundary. The images were taken under different lighting conditions and have been contrast enhanced. Bottom panels: comparison of the cell viability data between our previous [11] and current work for exposure to 1, 3, 5, and 7 molal glycerol. Error bars represent the standard deviation. We subjected our previous data set to the outlier analysis described in the methods section of the current study.
