
Figure 6.
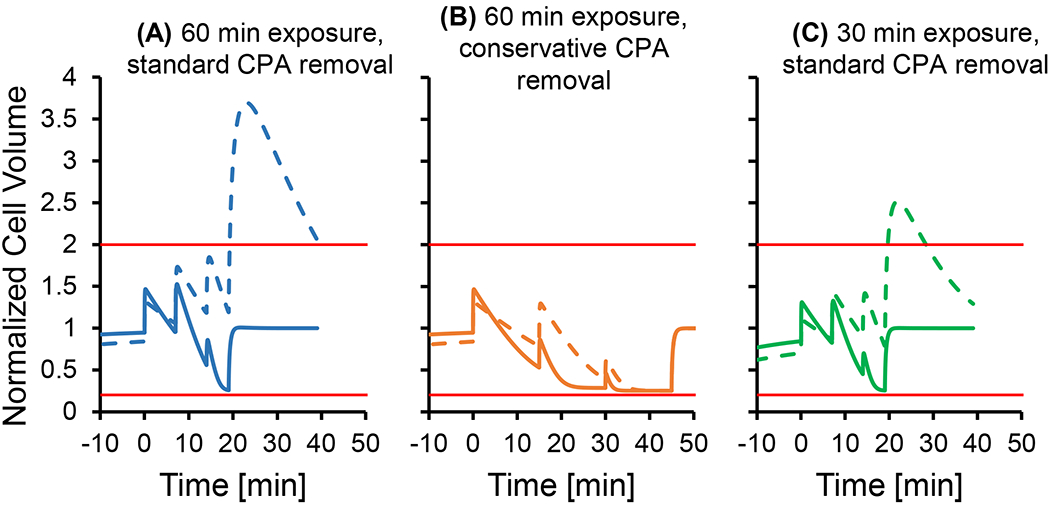
Cell volume predictions for multi-step CPA removal after exposure to 7 molal glycerol. Solid lines show predictions using published permeability values [29], while the dashed lines show predictions using a 2x lower glycerol permeability. Horizontal red lines show the osmotic tolerance limits [11]. Panel A shows the cell volume predictions after 60 min exposure to glycerol using standard hold times for each CPA removal step, while Panel B shows predictions when the step times are increased to 15 min each. In Panel C, cell volume predictions are shown after a 30 min exposure using standard hold times during CPA removal. In all simulations, a temperature of 25 °C was used.