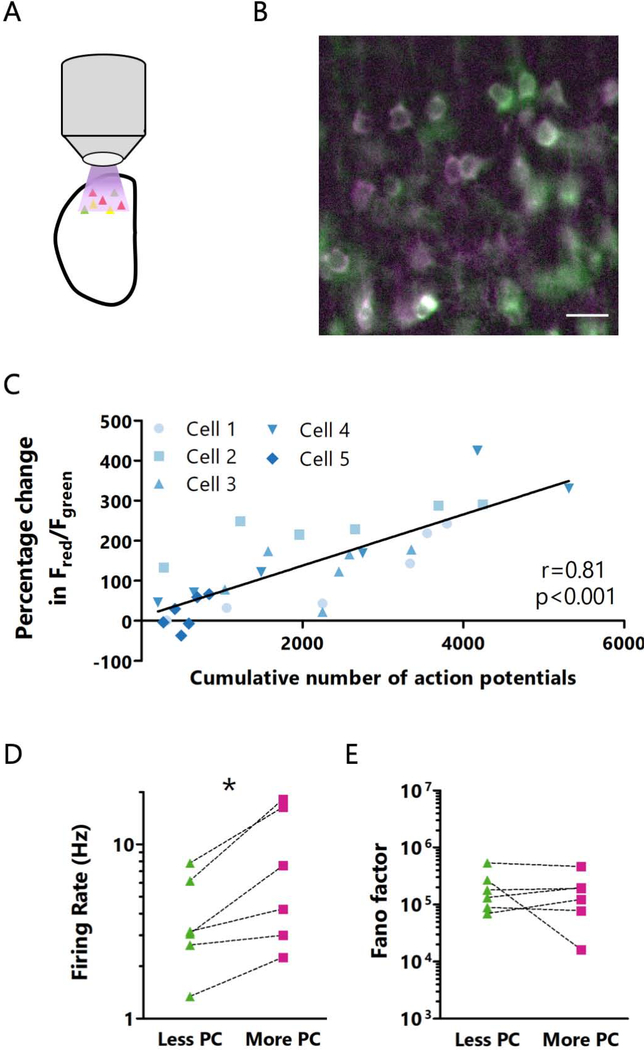
Figure 3: CaMPARI2 photoconversion rate is correlated with firing rates measured ex vivo.
A: Cartoon of experimental paradigm for ex vivo CaMPARI2 photoconversion. B: Representative image of ex vivo CaMPARI2 photoconversion. Scale bar = 20 μm. C: Correlation between the percentage change in red/green ratio and total action potential number during 30 minutes of photoconversion, measured at 5-minute intervals. Line represents linear best fit. r = Spearman’s rank correlation coefficient. n = 5 cells from L4 from 4 animals. D: Comparison of firing rates between pairs of neurons during 10 minutes of ex vivo photoconversion. n = 6 cells from L4 from 4 animals. E: Comparison of Fano factors between pairs of neurons sorted by red/green ratio following 10 minutes of ex vivo photoconversion. n = 6 cells from L4 from 4 animals. See also Figure S3.

