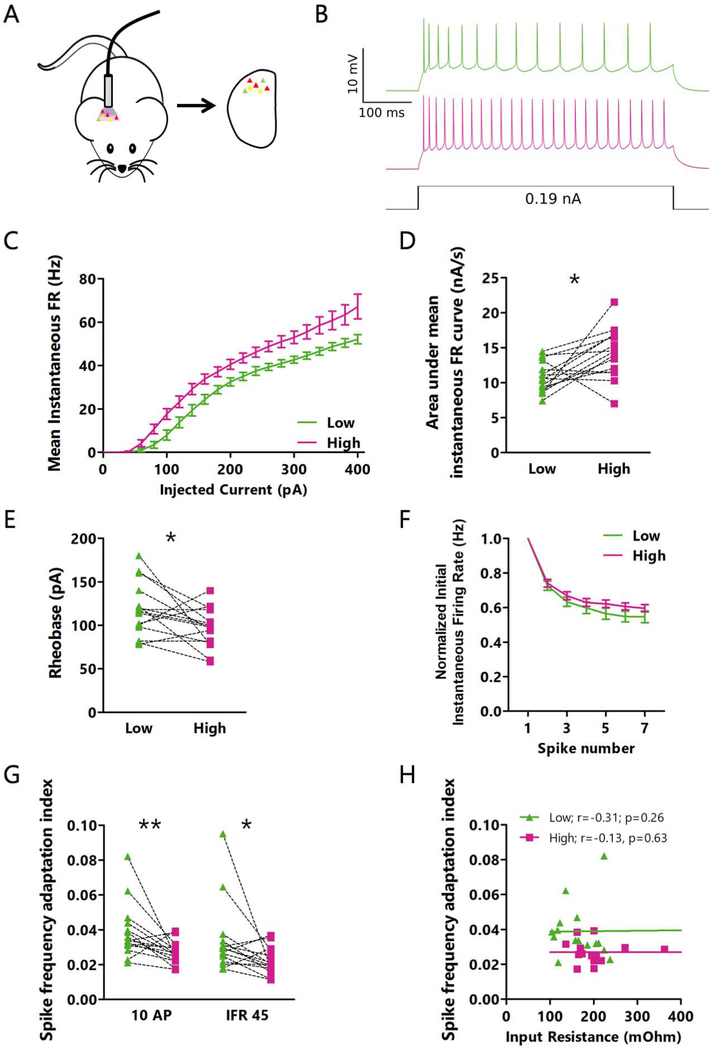
Figure 5: Intrinsic excitability differs between high and low activity pyramidal neurons in L4.
A: Cartoon of experimental paradigm for in vivo photoconversion. B: Representative current clamp recordings for intrinsic excitability measurements from a pair of neurons with low (green) and high (red) photoconversion. C: Mean instantaneous firing rate versus current injection (F-I) for pairs of neurons photoconverted in vivo. D: Comparison of the area under the F-I curve (from C) for each neuron pair. * p=0.010, paired t-test. Mean of differences: −3.359; CI: −5.786 to −0.9312. E: Comparison of the rheobase values for each neuron pair. * p=0.037, paired t-test. Mean of differences: 21.33; CI: 1.489 to 41.18. F: Frequency versus action potential number for the smallest current step that produced an initial instantaneous firing rate of 45 Hz. For each neuron, values are normalized to its initial instantaneous firing rate. G: Adaptation index for high and low FR neurons. Traces were selected from different current steps depending on the number of action potentials (left, smallest current injection to produce 10 action potentials) or mean instantaneous firing rate (right, smallest current injection to produce a mean instantaneous firing rate of 45 Hz). ** p=0.0084; * p=0.018, Wilcoxon matched pairs signed rank test. Sum of signed ranks: 90; 82. H: Correlation between input resistance and adaptation index (for 10 AP current step) for all neurons. r = Spearman’s rank correlation coefficient. C through H: n = 15 pairs of cells from L4 from 7 animals. See also Figure S4.

