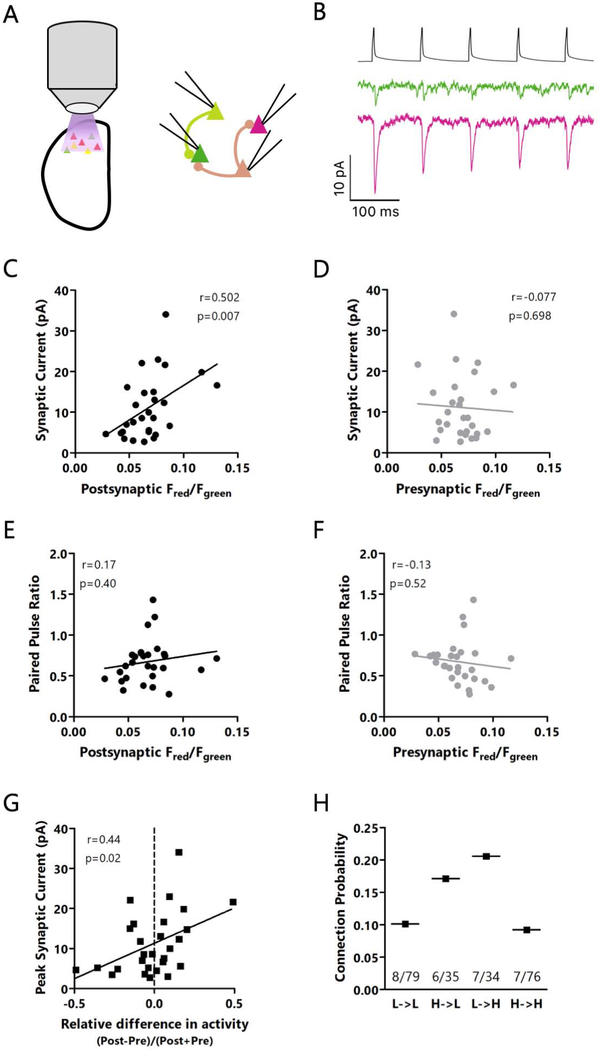
Figure 8: Recurrent L4 excitatory inputs, but not outputs, differ between high and low activity neurons.
A: Cartoon of experimental paradigm: ex vivo CaMPARI2 photoconversion followed by quadruple recordings to analyze monosynaptic EPSCs. B: Top: presynaptic spike train. Bottom: representative traces showing monosynaptic EPSCs onto two neurons with low (green) or high (red) CaMPARI2 photoconversion. C: Correlation between red/green ratio of the postsynaptic cell and the EPSC amplitude in response to the first spike in a train. D: Correlation between red/green ratio of the presynaptic cell and the EPSC amplitude. E: Correlation between red/green ratio of the postsynaptic cell and the EPSC paired-pulse ratio. F: Correlation between red/green ratio of the presynaptic cell and the EPSC paired-pulse ratio. G: Correlation between the activity difference between post- and presynaptic neurons, normalized by the combined activity of the pre- and postsynaptic neuron. Positive values indicate a greater relative activity of the postsynaptic neuron, and negative values represent greater relative activity of the presynaptic neuron. H: Comparison of connection probabilities based on the activity level of the pre- or postsynaptic neurons. p=0.065, χ2 test. C through G: r = Spearman’s rank correlation coefficient. C through H: n = 28 pairs of connected neurons from L4 from 13 animals out of 224 pairs of neurons from L4 tested from 16 animals. Each point is the average of 20 traces. See also Figure S6.

