
Figure 1 – Characterization of mouse TET fC/caC catalytic mutants.
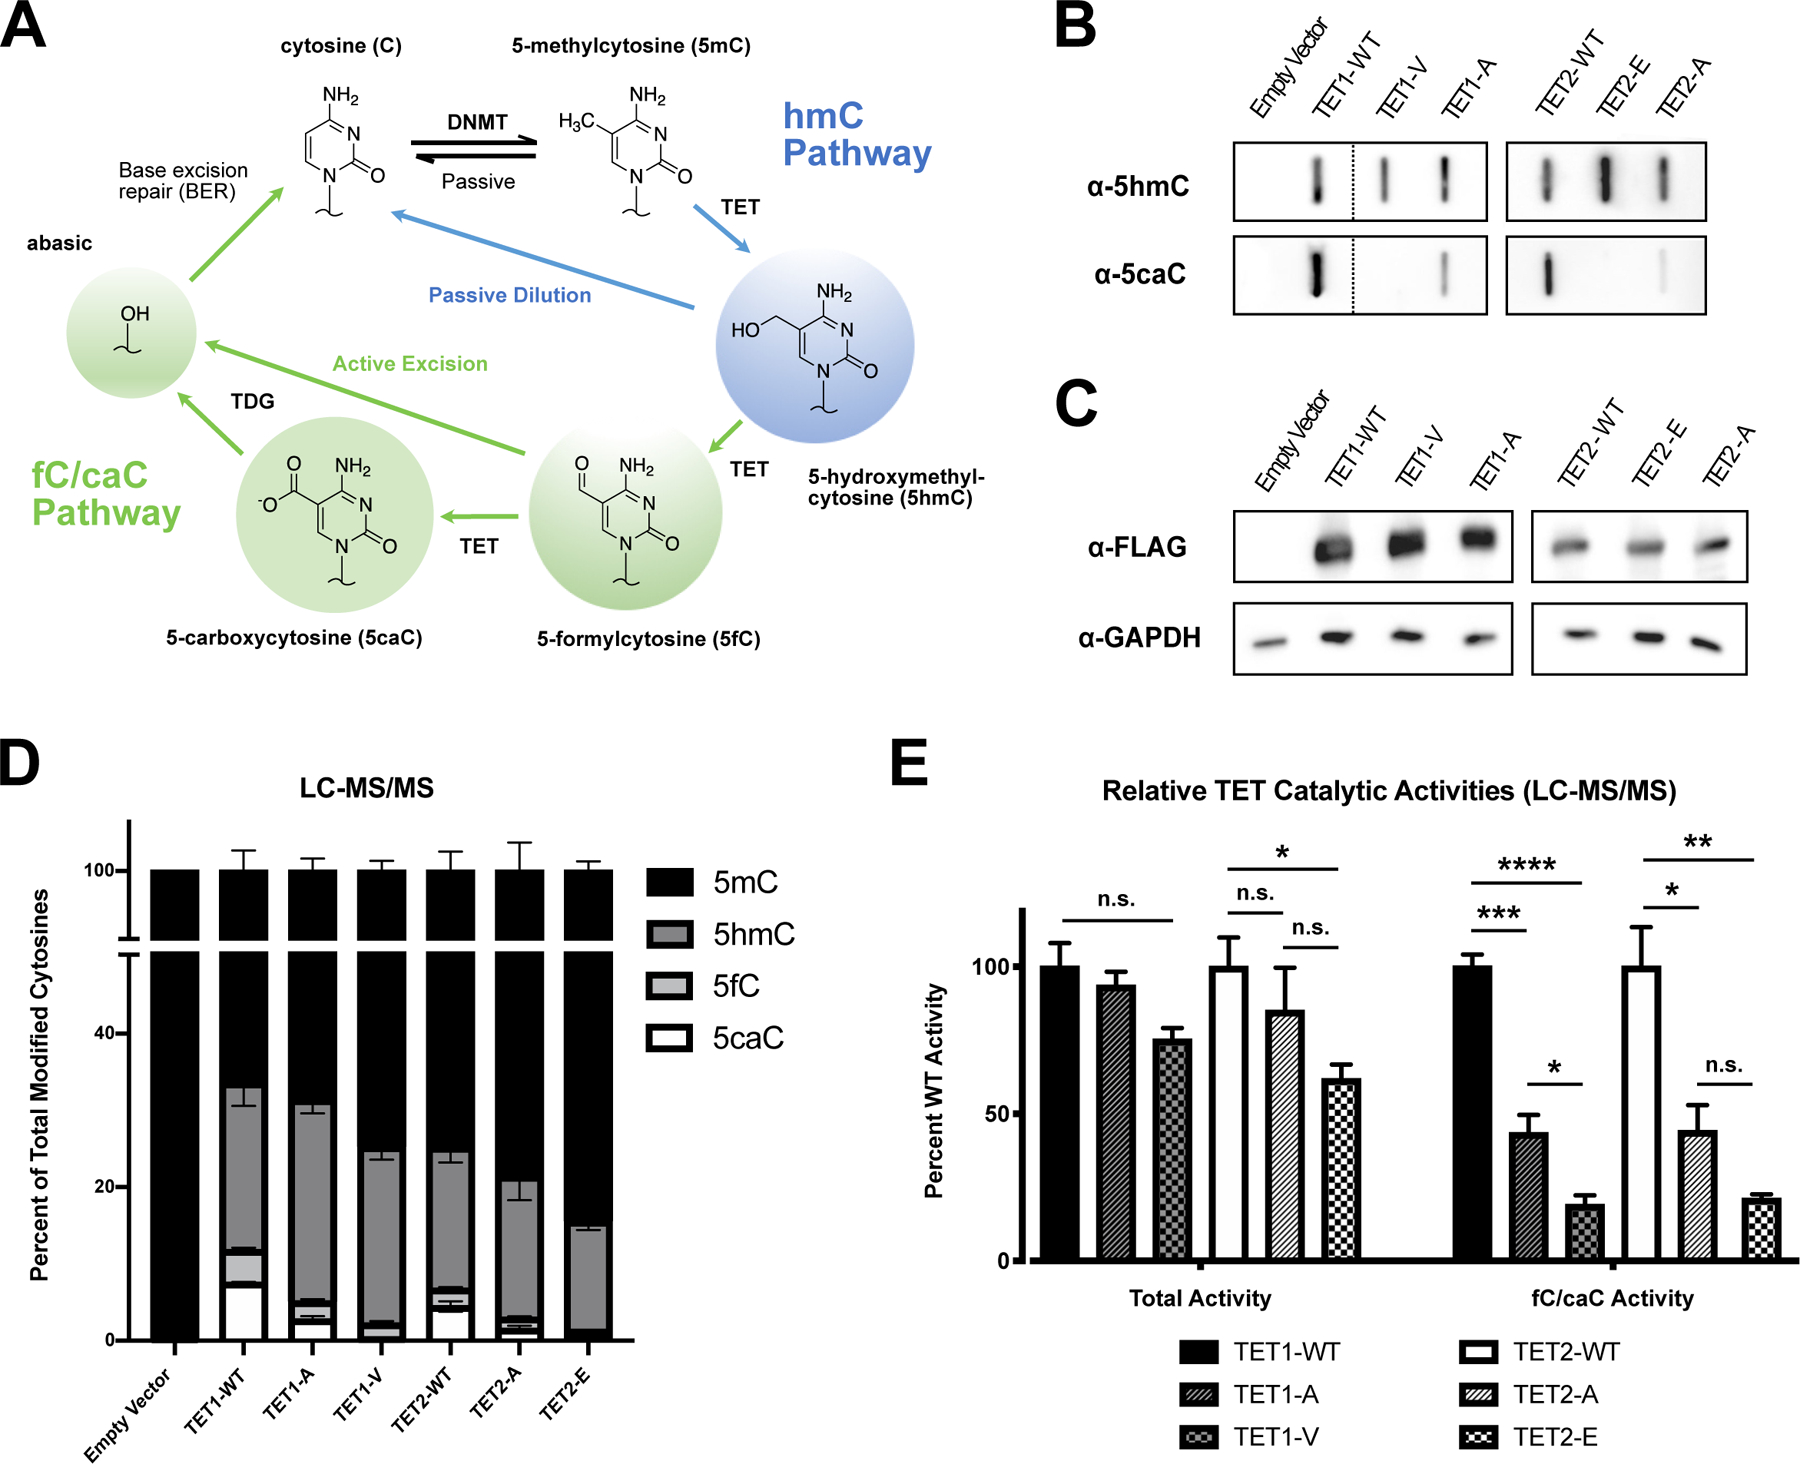
(A) Schematic representation of DNA demethylation pathways. (B) Representative slot blots for 5hmC and 5caC in DNA from transfected HEK293T cells (n=5; note: Tet1 results spliced from full blot in S1B). (C) Western blot for FLAG-tagged TET catalytic variant expression. Variants tested included wild-type (WT), 5hmC-stalling (T>V or T>E), and low-efficiency (T>A) TET1 and TET2, respectively, and empty vector control. GAPDH served as a loading control. (D) Genomic levels of modified cytosines quantified by LC-MS/MS and expressed as the percentage of total modified cytosines present in each sample (mean ± SEM; n=3–4). (E) Relative catalytic activities of TET1 and TET2 variants. Modified cytosines were normalized to their mean levels in cells transfected with WT Tet1 or Tet2. Relative catalytic activities are presented as total TET activity (5hmC + 5fC + 5caC) or specific fC/caC activity (mean ± SEM; n=3–4; one-way ANOVA with Tukey multiple comparisons; n.s. = not significant; *p < 0.05; **p < 0.01; ***p < 0.001; ****p < 0.0001).