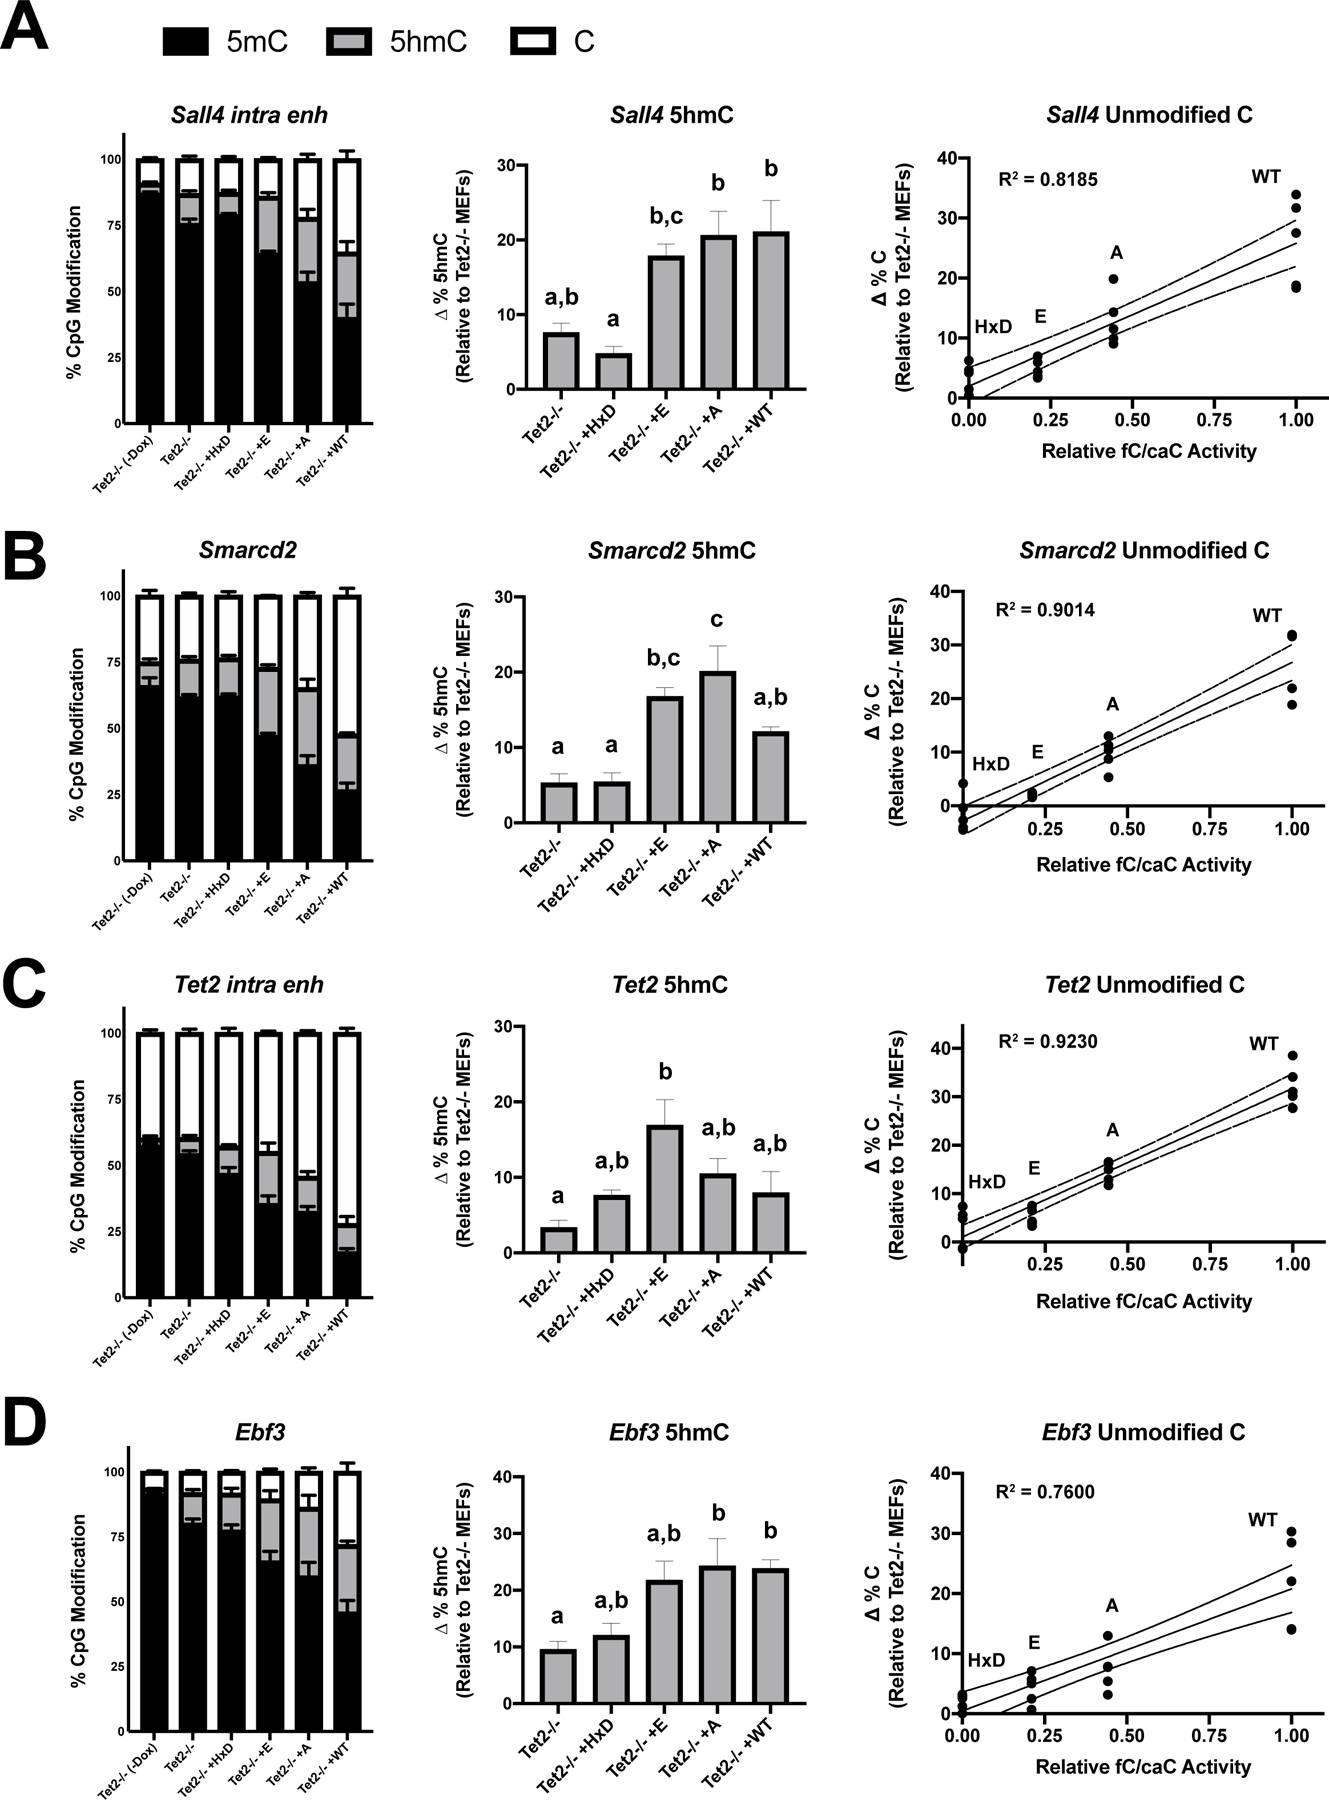
Figure 3 – DNA demethylation at Klf4 reprogramming enhancers correlates with TET2 fC/caC activity.

Relative levels of 5mC, 5hmC, and unmodified cytosine at (A) Sall4, (B) Smarcd2, (C) Tet2, and (D) Ebf3 proximal enhancers in untreated Tet2−/− MEFs or retrovirally transduced cells at day 5, as measured by combined BS-, bACE-, and MAB-pyrosequencing. For the central and right panels, change in 5hmC and unmodified cytosine levels were calculated by subtracting mean levels in untreated Tet2−/− MEFs. Bar graphs represent mean ± SEM, with letters designating statistically distinct groups (one-way ANOVA with Tukey multiple comparisons). For the right panel, data points represent independent experiments plotted against relative fC/caC activity values determined from HEK overexpression experiments (Fig. 1E). Simple linear regressions were performed for each enhancer, with the line of best fit (solid) and 95% confidence intervals (dotted) indicated (n=4–5).
