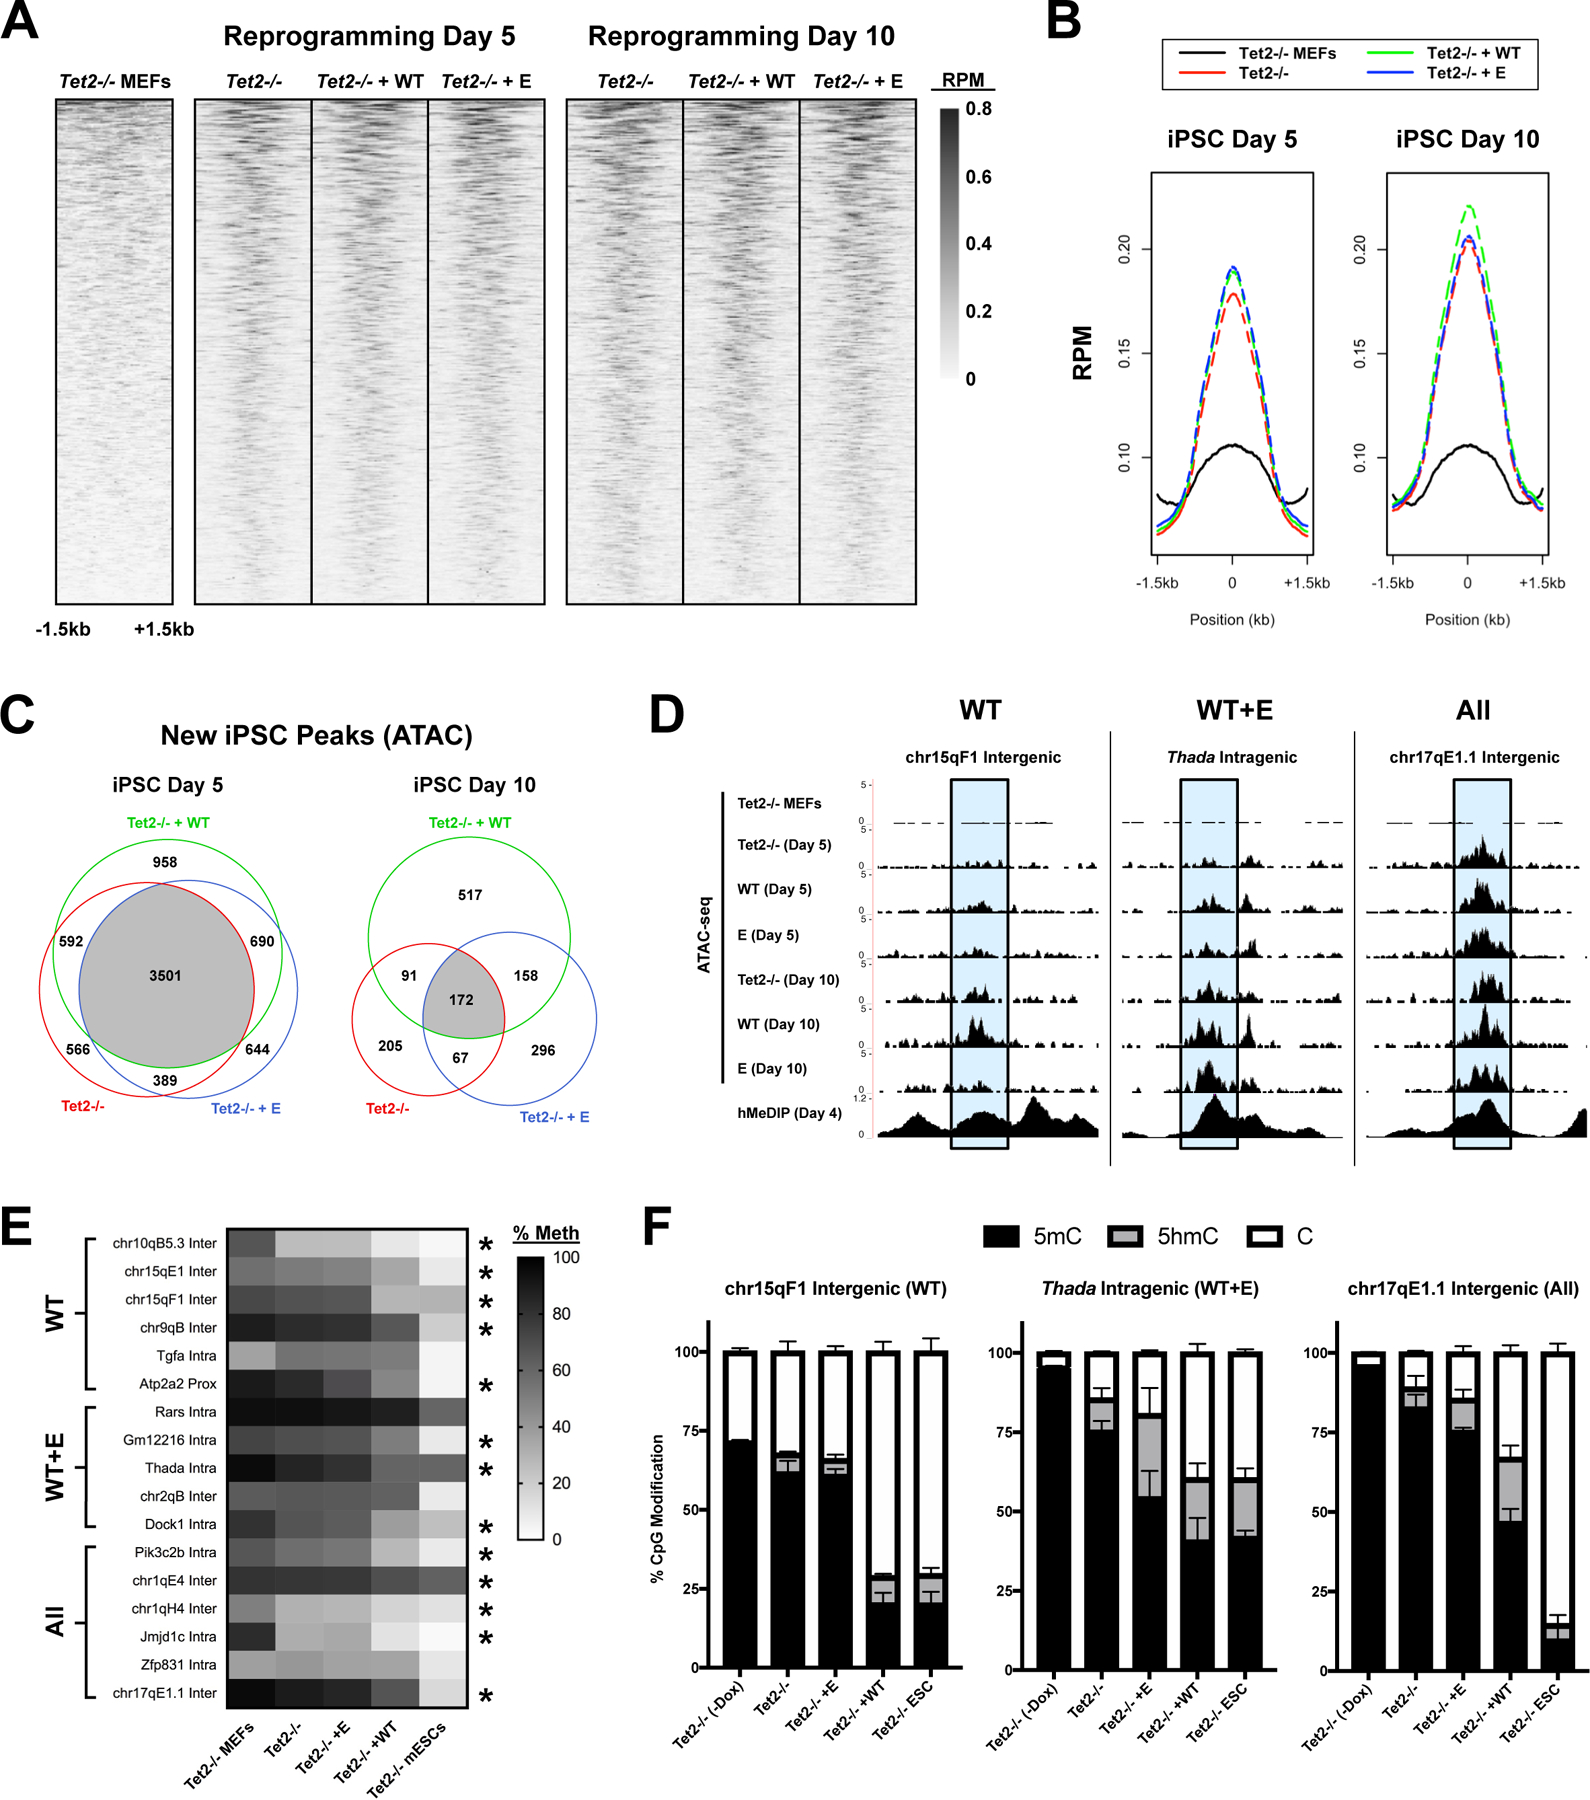
Figure 4 – Differential requirements for fC/caC activity for chromatin opening during reprogramming.

(A) Heatmaps of ATAC-seq signal at iPSC-specific accessible regions overlapping 5hmC peaks (GEO: GSE103470) (Sardina et al., 2018), measured in reads per million (RPM). Plots are individually sorted, centered at 5hmC peak summits, and represent the average of 4 biological replicates. (B) Metaplot of ATAC-seq signal at 5hmC peaks. (C) Venn diagrams of highly reproducible ATAC-5hmC peaks (present in ≥ 3/4 replicates) between different conditions. Peaks are subdivided based on the time point at which the ATAC peak was first observed. (D) Representative examples of WT-specific (WT), WT- and E-specific (WT+E), and shared (All) ATAC peaks overlapping 5hmC peaks (shaded in blue). UCSC genome browser snapshots include ATAC signal (merge of 4 biological replicates) for each condition at day 5 or 10, as well as hMeDIP signal at iPSC day 4 (Sardina et al., 2018). (E) Heatmap of mean DNA methylation (5mC+5hmC) at ATAC-5hmC peaks (n=3–4; * significantly reduced in WT vs. MEFs / Tet2−/− / E; one-way ANOVA with Tukey multiple comparisons). (F) Relative level of unmodified cytosine, 5hmC, and 5mC at representative ATAC-5hmC peaks from (D) in untreated Tet2−/− MEFs, untreated Tet2−/− mESCs, or transduced Tet2−/− cells at day 5 (n=3–4).
