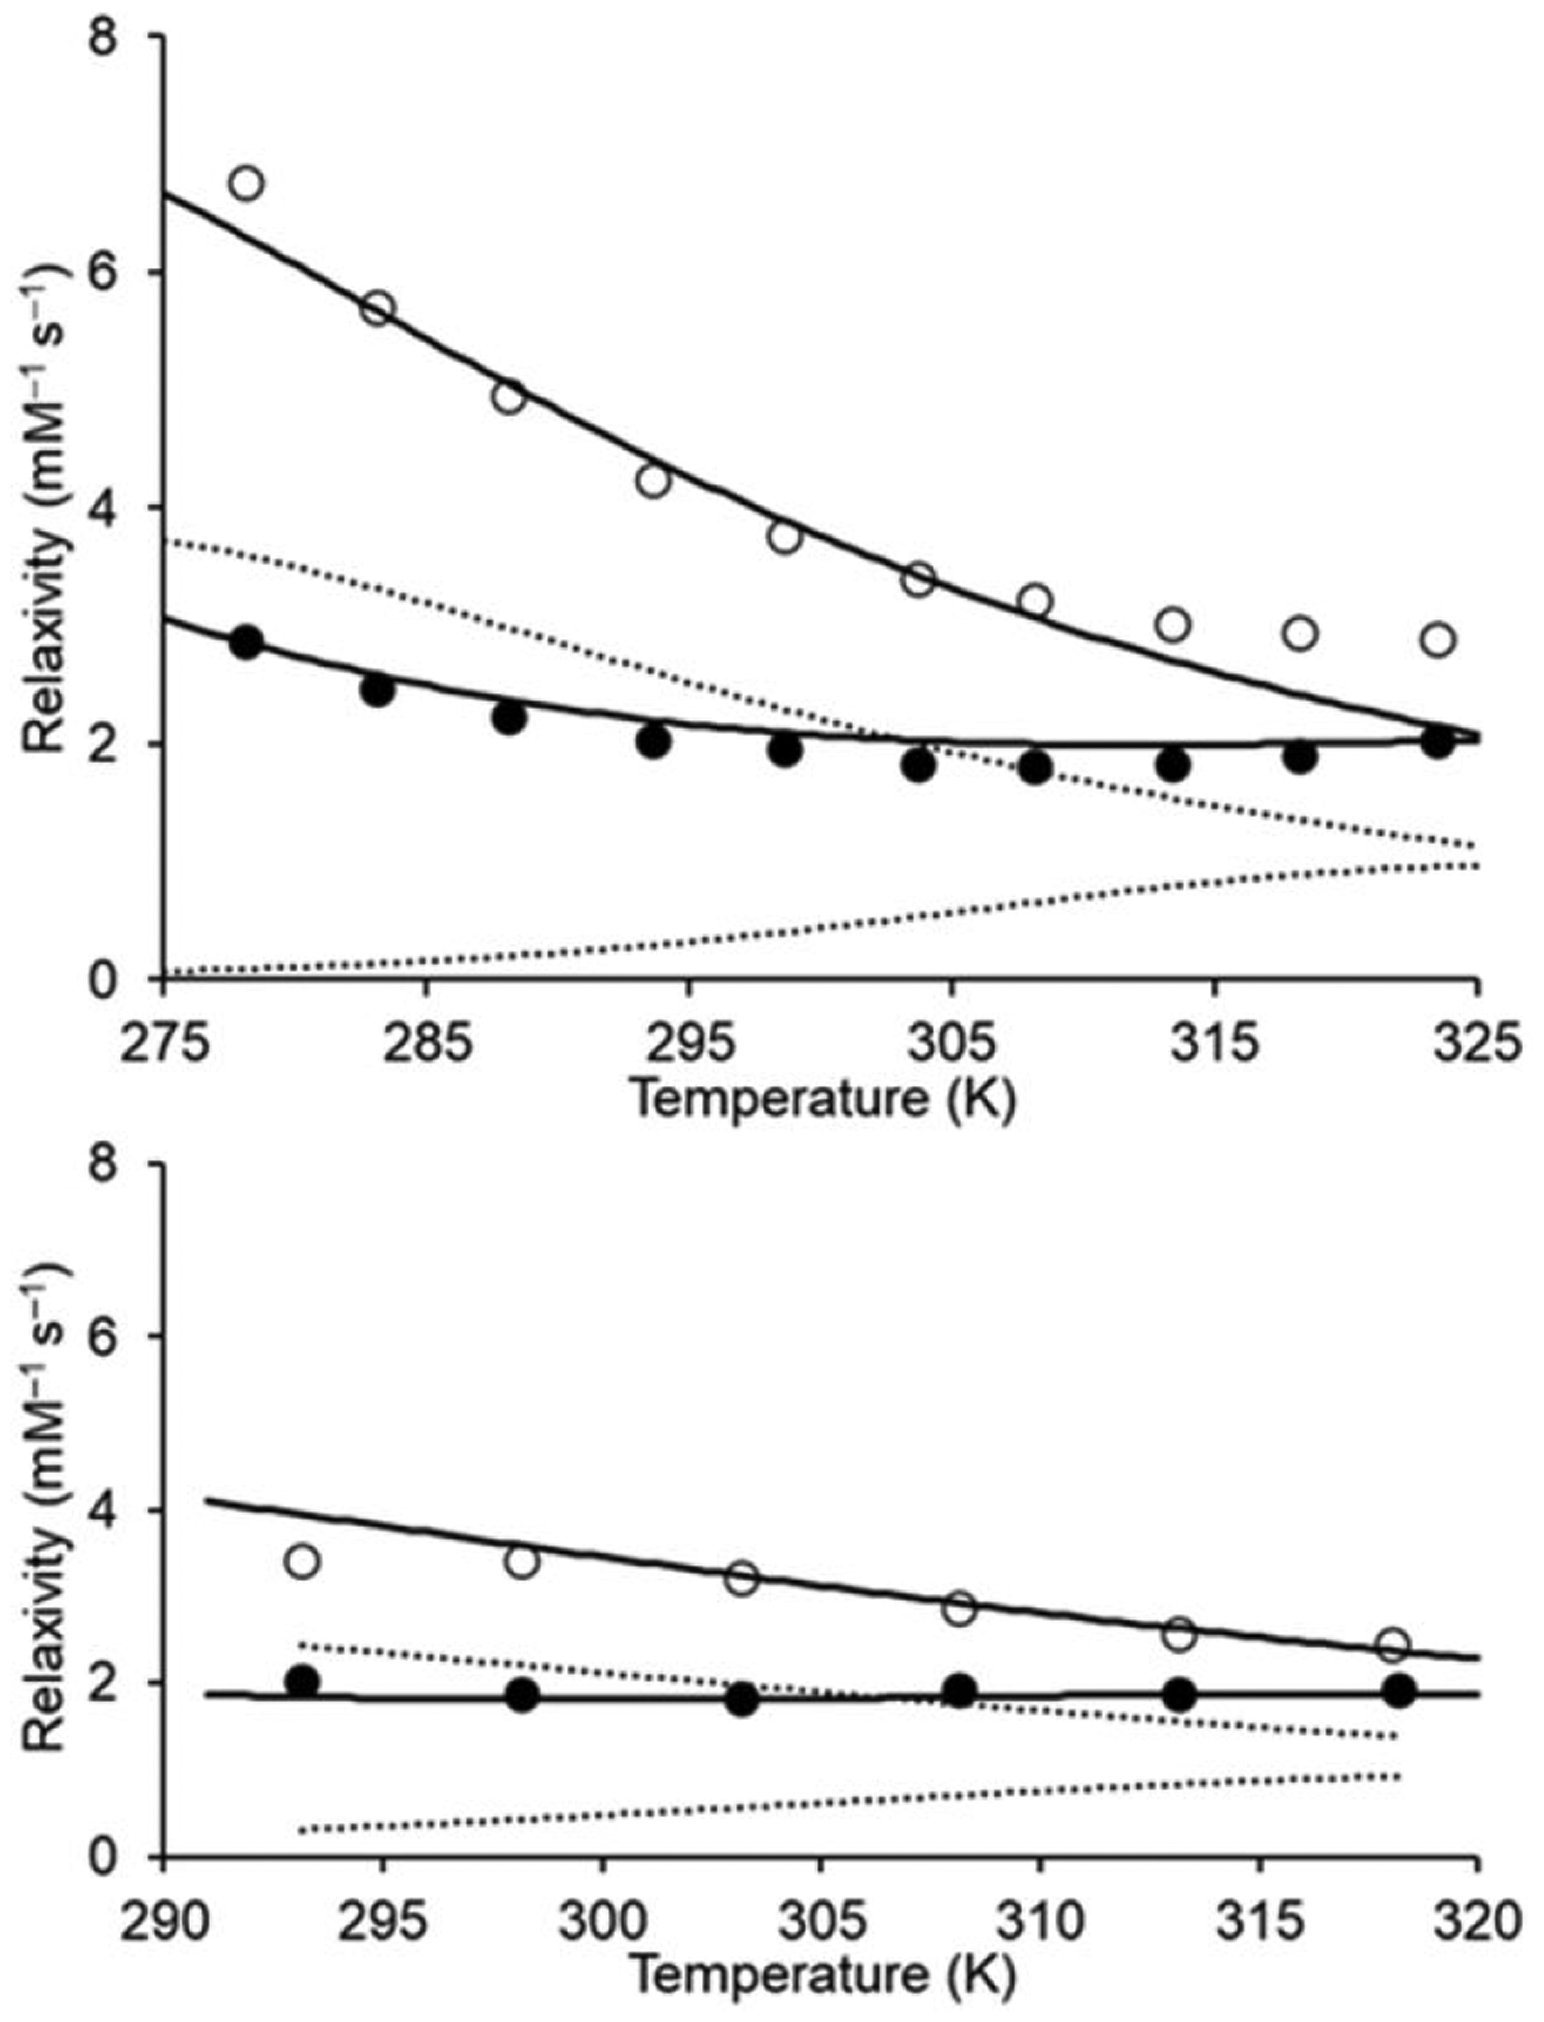
Fig. 2.

Plots of relaxivity vs temperature at (top) 1.4 and (bottom) 9.4 T. Solutions of 1 (●) and 2 (○) used for relaxivity measurements were prepared in aqueous 3-morpholinopropane-1-sulfonic acid buffer (pH 7.4). The solid and dashed lines, representing total and innersphere relaxivity, respectively, were calculated using NMRD best-fit parameters (Table S4).
