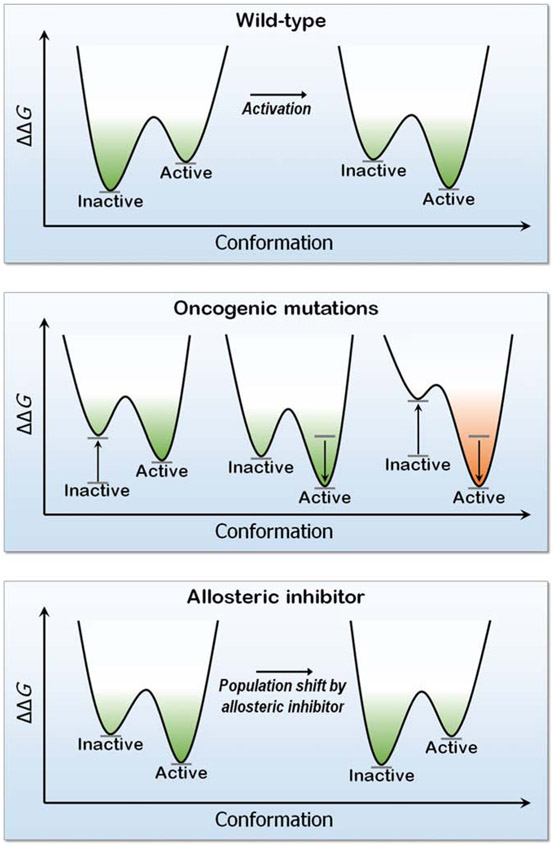
Figure 1.
The free energy landscape ΔΔG of a kinase conformation (here EGFR), the effect of mutations and an allosteric inhibitor. Oncogenic driver mutations (L858R and T790M), destabilize the inactive state (left plot in the middle panel), stabilize the active state (center plot) or both (right plot). The outcome is a shift of the ensemble toward the constitutively active EGFR conformation. In the bottom panel, an allosteric drug binding EGFR’s mutant surface stabilizes this conformation, with a population shift toward this conformation. The drug modulates the active site shape.

