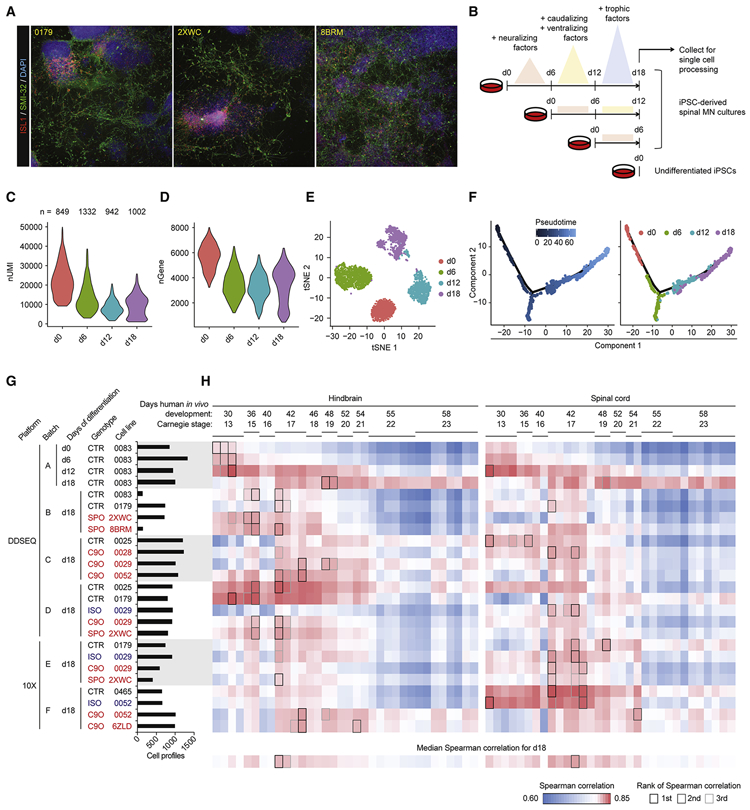
Figure 1. iPSC-MN cultures recapitulate developmental gene expression patterns.
A. Immunostaining day 18 cultures from three individual subject lines for expression of MN markers ISL1 and SMI-32.
B. Experiment schematic for analyzing the 18 day time course of MN differentiation.
C - D. Violin plots indicate gene expression during MN differentiation. C depicts number of unique molecular identifiers (nUMI), and D depicts number of detectable genes per time point.
E. tSNE of MN differentiation time course samples.
F. Monocle analysis projects samples into a pseudo-time axis consistent with the order of time points.
G. Histogram displays meta data for all samples profiled in this study. This data is also presented in Figure S4.
H. UMI counts were summed for each gene across the expression matrix for each sample, simulating bulk RNA-seq data. Simulated bulk gene expression profiles for each sample were correlated to bulk RNA-seq gene expression profiles from fetal hindbrain and spinal cord at various Carnegie stages analyzed in de Kovel et al., 2017. For each row of pairwise correlations, the top three ranked correlations are outlined, indicating which sample from de Kovel et al., 2017 is most globally similar to each sample analyzed by single-cell RNA-seq. For each column of pairwise correlations, the median Spearman correlation was calculated and displayed along the bottom row. These data summarize for each sample from de Kovel et al., 2017 what is the frequency of global gene expression correlations from iPSC-MN cultures. The top three ranked correlations along the bottom row are outlined, indicating which sample from de Kovel et al., 2017 are most globally similar to iPSC-MNs.
See also Figures S1, S2, S3, and S4, and Table S1.

