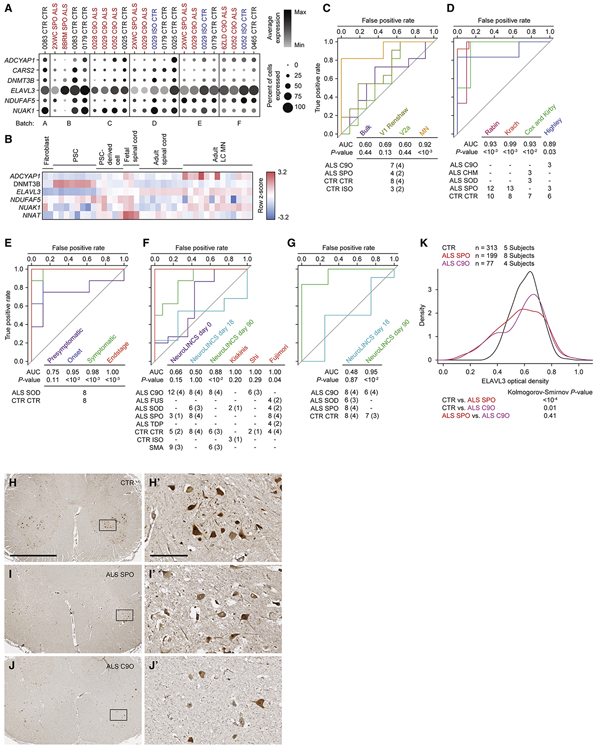
Figure 7. Single-cell analysis of iPSC-MNs reveals predictive ALS marker genes.
A. Split dot plots indicate percent of MNs within each sample that express a non-zero value of each of six predictive marker genes. Plots also indicate the average gene expression among MNs within each sample that express non-zero values of that gene.
B. Heatmap of five genes listed in A, along with NNAT demonstrating expression kinetics as tissues progress from embryonic, fetal, and adult spinal cord tissues (Ho et al., 2016). CARS2 was not annotated in this data set. Pluripotent stem cells (PSCs) include embryonic stem cells and iPSCs.
C - G. Receiver-operator characteristic (ROC) analysis performed on several data sets classifying samples in each data set as ALS or non-ALS, based on sample coordinates along the first, second, or both principal components using six predictive marker genes. See methods for calculations. P-values for each area under the curve (AUC) are calculated using the Mann-Whitney U test to determine whether the AUC differs significantly from 0.5 (diagonal grey line), which indicates an uninformative test. The number of samples for each ALS and non-ALS case used in the analysis, along with their genotypes are indicated. The number of genetically distinct subjects included in the analysis are indicated in parentheses. Familial ALS subjects with pathogenic variants in C9orf72 (C9O), CHMP2B (CHM), FUS, SOD1 (SOD), TARDBP (TDP). Sporadic ALS subjects with no known pathogenic variants (SPO). Non-ALS control subjects (CTR). C9orf72 or SOD1 subject lines in which the pathogenic variant has been genome edited (ISO). Spinal muscular atrophy subjects classified as non-ALS (SMA). C. ROC analysis performed on subpopulation data generated from scRNA-seq data set based on a combined metric of average and percent expression for the six predictive marker genes. D. ROC analysis performed on LC MN expression data sets (Cox et al., 2010; Highley et al., 2014; Kirby et al., 2011; Krach et al., 2018; Rabin et al., 2010). E. ROC analysis performed on mouse LCM MNs (Nardo et al., 2013). F. ROC analysis performed on bulk RNA-seq data sets generated by the NeuroLINCS Consortium for undifferentiated iPSCs (day 0), two MN differentiation protocols at days 18 and 90, and iPSC-MNs from Fujimori et al., 2018; Kiskinis et al., and 2014; Shi et al., 2018. G. ROC analysis performed on bulk proteomics data sets generated by the NeuroLINCS Consortium for two MN differentiation protocols at days 18 and 90. ELAVL3 protein expression is used as the prediction.
H - J. Representative images of lumbar spinal cord sections from control, sporadic, and C9orf72 ALS subjects immunostained for ELAVL3 and counterstained with hematoxylin. Scale bar, 2.5 mm for H, I, and J; 250 μm for inset images H’, I’, and J’.
K. Comparative distributions of ELAVL3 optical densities.
See also Figure S7.

