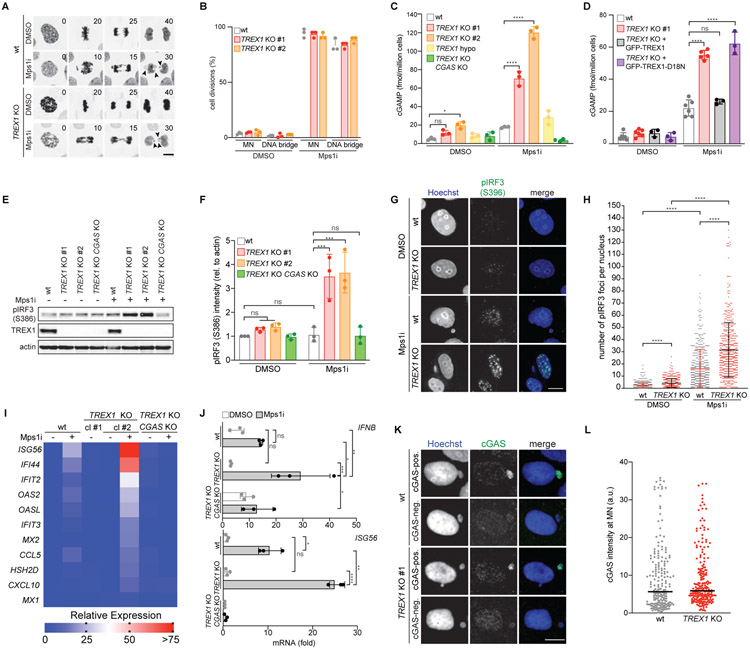
Figure 1. TREX1 inhibits cGAS activation at MN.
(A) Live-cell imaging of the indicated MCF10A cells expressing H2B-RFP. Insets mark time in minutes since mitotic NE breakdown (t = 0). Arrows mark mis-segregating chromosomes. (B) Quantification of cell divisions resulting in the formation of MN or DNA bridges as shown in (A). Mean and s.d. of n = 3 experiments (>50 cells analyzed per experiment) are shown. (C,D) ELISA analysis of cGAMP production in the indicated cells. Mean and s.d. of n = 3 experiments are shown. (E) Immunoblotting for pIRF3(S386), TREX1 and actin in the indicated MCF10A cells. (F) Quantification of pIRF3(S386) relative to corresponding actin signal as shown in (E). Mean and s.d. of n = 3 experiments are shown. (G) Immunofluorescence for pIRF3(S396) in the indicated MCF10A cells. (H) Quantification of pIRF3(S396) foci as shown in (G). Mean and s.d. of n = 2 experiments are shown (>250 cells quantified per replicate). P values were calculated by Kruskal-Wallis test for multiple comparisons (****P < 0.0001). (I) Nanostring expression analysis in the indicated MCF10A cells. (n = 1 experiment). (J) RT-qPCR of IFNB and ISG56 expression in the indicated MCF10A cells. Mean and s.d. of n = 3 experiments are shown. (K) Immunofluorescence for cGAS in the indicated MCF10A cells. (L) cGAS signal intensity with median as in (K) (n = 3 experiments with >60 MN quantified per experiment). Unless otherwise specified all P values were calculated by one-way ANOVA with Tukey’s multiple comparisons test (*P < 0.05, **P < 0.01, ***P < 0.001, ****P < 0.0001, ns = not significant). Scale bars = 10 μm.

