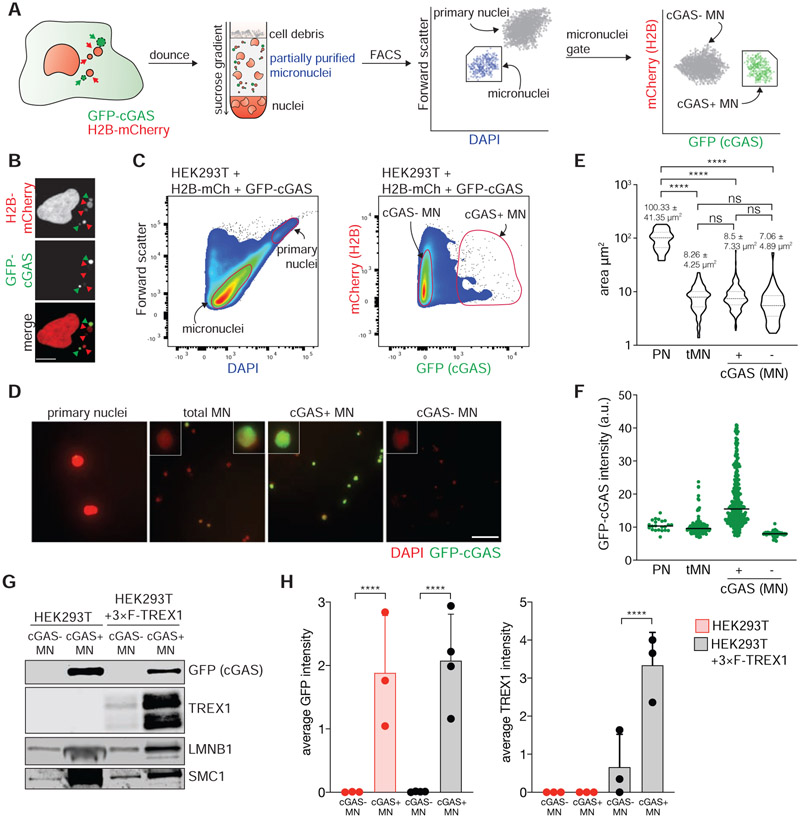
Figure 2. Purification of cGAS-positive MN.
(A) Schematic of MN purification. (B) Immunofluorescence for mCherry and GFP in HEK293T + H2B-mCherry + GFP-cGAS cells. Green arrows mark cGAS-positive MN, red arrows mark cGAS-negative MN. Scale bar = 10 μm. (C) Flow profiles of cGAS-negative and cGAS-positive MN isolated by FACS. (D) Immunofluorescence for GFP (cGAS) in the indicated fractions after FACS. Scale bar = 25 μm. (E) Measurement of the area of sorted primary nuclei (PN) and MN sorted by FACS. (F) Quantification of the GFP-cGAS signal intensity as shown in (D). (G) Immunoblotting for the indicated proteins in MN sorted from parental and 3×FLAG-TREX1 overexpressing HEK293T cells. (H) Quantification of relative cGAS and TREX1 signals normalized to loading control (SMC1 or histone H3) as shown in (G). Mean and s.d. of n = 3 experiments are shown. All P values were calculated by one-way ANOVA with Tukey’s multiple comparisons test (****P < 0.0001, ns = not significant).

