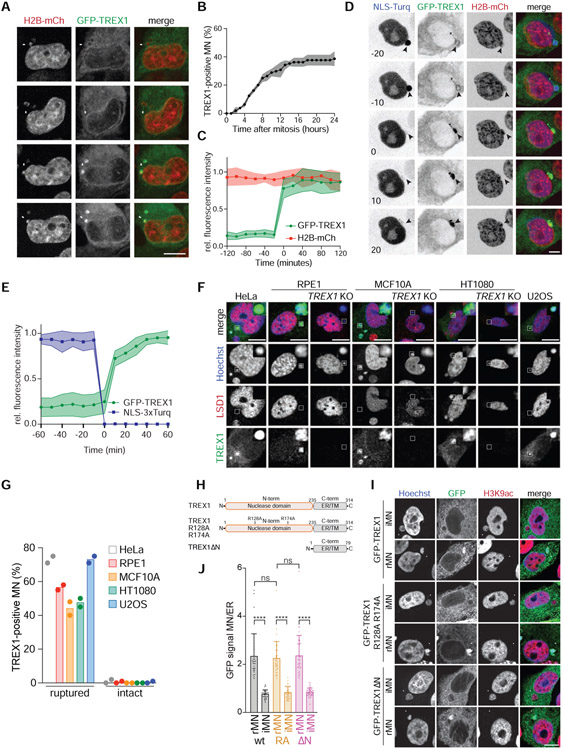
Figure 3. TREX1 localizes to MN after MNE rupture.
(A) Live-cell imaging of MCF10A cells expressing GFP-TREX1 and H2B-mCherry. Arrows mark MN. (B) Quantification of the cumulative percentage of TREX1-positive MN as shown in (A). Error bars show s.d. of 45 MN quantified across n = 3 experiments. (C) Quantification of the relative fluorescence signal intensities of GFP-TREX1 and H2B-mCherry at MN (t = 0, initial TREX1 localization) as shown in (A). Relative mean fluorescence intensities and s.d. of 11 MN from n = 2 experiments are shown. (D) Live-cell imaging of MCF10A cells expressing GFP-TREX1, H2B-mCherry and NLS-3×mTurquoise2 (t = 0, MNE rupture). (E) Quantification of the relative fluorescence signal intensities of GFP-TREX1 and NLS-3×mTurquoise2 as shown in (D). Mean and s.d. of 15 MN from n = 3 experiments are shown. (F) Immunofluorescence for TREX1 and LSD1 in the indicated cells. Insets show magnified regions. (G) Quantification of the percentage of TREX1-positive ruptured and intact MN as shown in (F). Mean of n = 2 experiments are shown (>90 MN quantified per replicate and cell line). (H) Schematic of full-length TREX1, TREX1 R128A R174A (RA), and TREX1ΔN (amino acids 2-235 deleted). (I) Immunofluorescence for GFP (TREX1) and H3K9ac in the indicated MCF10A cells. Arrows denote MN. (J) Quantification of TREX1 signal intensity at ruptured (rMN) and intact MN (iMN) relative to TREX1 signal intensity at the ER. Data represent >30 MN quantified from n = 3 experiments. Mean and s.d. are indicated. P values were calculated by one-way ANOVA with Tukey’s multiple comparisons test (****P < 0.0001, ns = not significant). All scale bars = 10 μm.

